2010 Senatorial General Election Data Graphs - Vermont
by County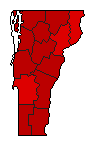
| Addison | Leahy | 66.5% | |
| Britton | 29.5% | |
| Freilich | 1.4% | |
| Other | 2.5% | |
| Bennington | Leahy | 63.2% | |
| Britton | 28.7% | |
| Freilich | 4.0% | |
| Other | 4.1% | |
| Caledonia | Leahy | 56.0% | |
| Britton | 39.3% | |
| Freilich | 1.4% | |
| Other | 3.3% | |
| Chittenden | Leahy | 68.2% | |
| Britton | 27.9% | |
| Freilich | 1.1% | |
| Other | 2.7% | |
| Essex | Leahy | 52.1% | |
| Britton | 41.7% | |
| Freilich | 1.5% | |
| Other | 4.8% | |
| Franklin | Leahy | 60.5% | |
| Britton | 35.1% | |
| Freilich | 1.1% | |
| Other | 3.2% | |
| Grand Isle | Leahy | 60.5% | |
| Britton | 33.7% | |
| Freilich | 1.4% | |
| Other | 4.4% | |
| Lamoille | Leahy | 66.0% | |
| Britton | 30.3% | |
| Freilich | 0.8% | |
| Other | 2.9% | |
| Orange | Leahy | 61.9% | |
| Britton | 33.9% | |
| Freilich | 0.8% | |
| Other | 3.5% | |
| Orleans | Leahy | 60.3% | |
| Britton | 34.7% | |
| Freilich | 1.2% | |
| Other | 3.8% | |
| Rutland | Leahy | 55.4% | |
| Britton | 39.8% | |
| Freilich | 1.5% | |
| Other | 3.3% | |
| Washington | Leahy | 68.6% | |
| Britton | 26.9% | |
| Freilich | 1.4% | |
| Other | 3.1% | |
| Windham | Leahy | 69.3% | |
| Britton | 23.5% | |
| Freilich | 3.0% | |
| Other | 4.1% | |
| Windsor | Leahy | 64.3% | |
| Britton | 31.0% | |
| Freilich | 1.2% | |
| Other | 3.6% | |