2010 Secretary of State General Election Data Graphs - Vermont
by CountyData for this Contest was Contributed by on 2011-01-13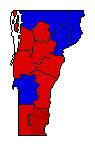
| Addison | Condos | 53.5% | |
| Gibbs | 44.3% | |
| Other | 2.2% | |
| Bennington | Condos | 55.1% | |
| Gibbs | 42.1% | |
| Other | 2.8% | |
| Caledonia | Condos | 43.1% | |
| Gibbs | 54.6% | |
| Other | 2.4% | |
| Chittenden | Condos | 59.8% | |
| Gibbs | 38.6% | |
| Other | 1.6% | |
| Essex | Condos | 39.0% | |
| Gibbs | 58.0% | |
| Other | 3.0% | |
| Franklin | Condos | 46.0% | |
| Gibbs | 51.6% | |
| Other | 2.4% | |
| Grand Isle | Condos | 49.7% | |
| Gibbs | 48.6% | |
| Other | 1.7% | |
| Lamoille | Condos | 51.0% | |
| Gibbs | 47.0% | |
| Other | 2.0% | |
| Orange | Condos | 50.2% | |
| Gibbs | 45.7% | |
| Other | 4.1% | |
| Orleans | Condos | 45.9% | |
| Gibbs | 51.3% | |
| Other | 2.8% | |
| Rutland | Condos | 42.7% | |
| Gibbs | 54.7% | |
| Other | 2.6% | |
| Washington | Condos | 55.6% | |
| Gibbs | 42.0% | |
| Other | 2.4% | |
| Windham | Condos | 63.3% | |
| Gibbs | 33.8% | |
| Other | 3.0% | |
| Windsor | Condos | 55.1% | |
| Gibbs | 41.7% | |
| Other | 3.2% | |