2010 Attorney General General Election Data Graphs - California
Note: The Google advertisement links below may advocate political positions that this site does not endorse.
Data for this Contest was Contributed by on 2010-11-15
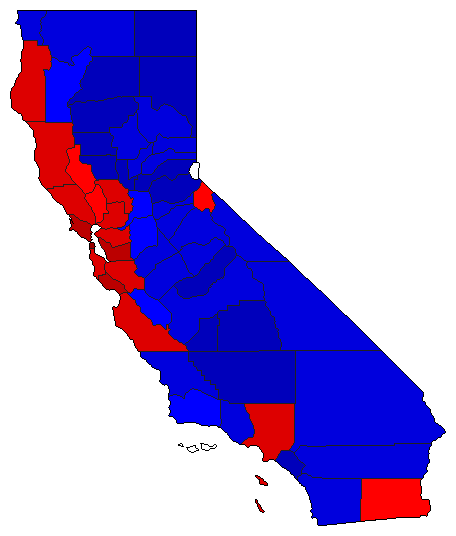
Map

AlamedaHarris66.5%
 
Cooley25.9%
 
Other7.6%


AlpineHarris47.3%
 
Cooley43.1%
 
Other9.6%


AmadorHarris27.7%
 
Cooley59.1%
 
Other13.2%


ButteHarris36.2%
 
Cooley52.0%
 
Other11.7%


CalaverasHarris28.7%
 
Cooley56.8%
 
Other14.5%


ColusaHarris28.4%
 
Cooley62.3%
 
Other9.3%


Contra CostaHarris53.4%
 
Cooley39.4%
 
Other7.2%


Del NorteHarris36.6%
 
Cooley51.8%
 
Other11.5%


El DoradoHarris29.7%
 
Cooley60.2%
 
Other10.1%


FresnoHarris35.5%
 
Cooley56.9%
 
Other7.6%


GlennHarris25.9%
 
Cooley62.6%
 
Other11.5%


HumboldtHarris50.1%
 
Cooley37.4%
 
Other12.6%


ImperialHarris48.6%
 
Cooley42.0%
 
Other9.4%


InyoHarris31.4%
 
Cooley56.3%
 
Other12.3%


KernHarris27.0%
 
Cooley63.5%
 
Other9.6%


KingsHarris30.0%
 
Cooley61.6%
 
Other8.5%


LakeHarris44.0%
 
Cooley42.9%
 
Other13.1%


LassenHarris22.5%
 
Cooley64.9%
 
Other12.7%


Los AngelesHarris53.2%
 
Cooley39.6%
 
Other7.2%


MaderaHarris29.4%
 
Cooley61.1%
 
Other9.5%


MarinHarris62.1%
 
Cooley31.0%
 
Other6.9%


MariposaHarris29.9%
 
Cooley57.8%
 
Other12.3%


MendocinoHarris54.0%
 
Cooley32.3%
 
Other13.7%


MercedHarris40.4%
 
Cooley50.9%
 
Other8.7%


ModocHarris21.2%
 
Cooley66.4%
 
Other12.4%


MonoHarris37.4%
 
Cooley51.3%
 
Other11.3%


MontereyHarris53.9%
 
Cooley37.7%
 
Other8.4%


NapaHarris50.0%
 
Cooley41.1%
 
Other8.9%


NevadaHarris37.8%
 
Cooley51.7%
 
Other10.5%


OrangeHarris31.1%
 
Cooley60.2%
 
Other8.7%


PlacerHarris29.7%
 
Cooley61.4%
 
Other8.9%


PlumasHarris30.2%
 
Cooley59.0%
 
Other10.8%


RiversideHarris36.5%
 
Cooley55.4%
 
Other8.1%


SacramentoHarris44.7%
 
Cooley47.2%
 
Other8.1%


San BenitoHarris45.2%
 
Cooley45.6%
 
Other9.2%


San BernardinoHarris37.0%
 
Cooley52.9%
 
Other10.1%


San DiegoHarris38.4%
 
Cooley52.3%
 
Other9.3%


San FranciscoHarris71.0%
 
Cooley20.5%
 
Other8.5%


San JoaquinHarris41.0%
 
Cooley48.5%
 
Other10.5%


San Luis ObispoHarris37.5%
 
Cooley52.3%
 
Other10.1%


San MateoHarris57.0%
 
Cooley35.4%
 
Other7.5%


Santa BarbaraHarris43.3%
 
Cooley47.9%
 
Other8.8%


Santa ClaraHarris54.8%
 
Cooley36.6%
 
Other8.6%


Santa CruzHarris61.9%
 
Cooley27.7%
 
Other10.4%


ShastaHarris26.9%
 
Cooley62.5%
 
Other10.7%


SierraHarris27.6%
 
Cooley58.2%
 
Other14.2%


SiskiyouHarris32.6%
 
Cooley54.6%
 
Other12.8%


SolanoHarris50.9%
 
Cooley41.1%
 
Other8.1%


SonomaHarris57.1%
 
Cooley32.8%
 
Other10.1%


StanislausHarris37.6%
 
Cooley53.6%
 
Other8.8%


SutterHarris29.9%
 
Cooley60.5%
 
Other9.6%


TehamaHarris26.8%
 
Cooley60.3%
 
Other12.9%


TrinityHarris36.2%
 
Cooley47.9%
 
Other15.9%


TulareHarris29.8%
 
Cooley62.3%
 
Other7.9%


TuolumneHarris31.4%
 
Cooley56.7%
 
Other11.9%


VenturaHarris38.8%
 
Cooley53.7%
 
Other7.4%


YoloHarris53.4%
 
Cooley38.3%
 
Other8.3%


YubaHarris30.0%
 
Cooley57.7%
 
Other12.3%


National DataGraph for 2010 - California Results for 2010

Login

Terms of Use - DCMA Policy - Privacy Policy and Cookies


© Dave Leip's Atlas of U.S. Elections, LLC 2019 All Rights Reserved