2012 Presidential General Election Data Graphs - Alabama
by County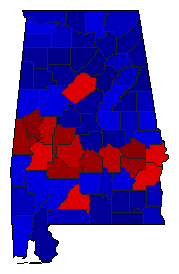
| Autauga | Obama | 26.5% | |
| Romney | 72.5% | |
| Other | 1.0% | |
| Baldwin | Obama | 21.6% | |
| Romney | 77.2% | |
| Other | 1.2% | |
| Barbour | Obama | 51.3% | |
| Romney | 48.2% | |
| Other | 0.5% | |
| Bibb | Obama | 26.2% | |
| Romney | 72.8% | |
| Other | 1.0% | |
| Blount | Obama | 12.3% | |
| Romney | 86.3% | |
| Other | 1.4% | |
| Bullock | Obama | 76.3% | |
| Romney | 23.5% | |
| Other | 0.2% | |
| Butler | Obama | 46.0% | |
| Romney | 53.5% | |
| Other | 0.4% | |
| Calhoun | Obama | 33.5% | |
| Romney | 65.3% | |
| Other | 1.2% | |
| Chambers | Obama | 47.0% | |
| Romney | 52.1% | |
| Other | 0.9% | |
| Cherokee | Obama | 21.8% | |
| Romney | 76.7% | |
| Other | 1.6% | |
| Chilton | Obama | 19.4% | |
| Romney | 79.7% | |
| Other | 0.9% | |
| Choctaw | Obama | 47.5% | |
| Romney | 52.1% | |
| Other | 0.5% | |
| Clarke | Obama | 45.7% | |
| Romney | 53.9% | |
| Other | 0.4% | |
| Clay | Obama | 26.6% | |
| Romney | 72.1% | |
| Other | 1.3% | |
| Cleburne | Obama | 15.4% | |
| Romney | 83.4% | |
| Other | 1.2% | |
| Coffee | Obama | 24.8% | |
| Romney | 74.0% | |
| Other | 1.2% | |
| Colbert | Obama | 39.1% | |
| Romney | 59.4% | |
| Other | 1.5% | |
| Conecuh | Obama | 50.6% | |
| Romney | 49.0% | |
| Other | 0.4% | |
| Coosa | Obama | 41.5% | |
| Romney | 57.7% | |
| Other | 0.8% | |
| Covington | Obama | 20.5% | |
| Romney | 78.7% | |
| Other | 0.8% | |
| Crenshaw | Obama | 31.9% | |
| Romney | 67.4% | |
| Other | 0.7% | |
| Cullman | Obama | 14.6% | |
| Romney | 83.9% | |
| Other | 1.5% | |
| Dale | Obama | 28.4% | |
| Romney | 70.5% | |
| Other | 1.1% | |
| Dallas | Obama | 69.7% | |
| Romney | 30.0% | |
| Other | 0.3% | |
| DeKalb | Obama | 21.9% | |
| Romney | 76.5% | |
| Other | 1.6% | |
| Elmore | Obama | 25.2% | |
| Romney | 73.9% | |
| Other | 1.0% | |
| Escambia | Obama | 36.9% | |
| Romney | 62.4% | |
| Other | 0.8% | |
| Etowah | Obama | 30.0% | |
| Romney | 68.3% | |
| Other | 1.6% | |
| Fayette | Obama | 22.8% | |
| Romney | 76.1% | |
| Other | 1.1% | |
| Franklin | Obama | 29.1% | |
| Romney | 69.5% | |
| Other | 1.3% | |
| Geneva | Obama | 18.0% | |
| Romney | 81.0% | |
| Other | 1.0% | |
| Greene | Obama | 84.6% | |
| Romney | 15.0% | |
| Other | 0.3% | |
| Hale | Obama | 62.6% | |
| Romney | 37.1% | |
| Other | 0.3% | |
| Henry | Obama | 35.2% | |
| Romney | 64.2% | |
| Other | 0.6% | |
| Houston | Obama | 29.5% | |
| Romney | 69.7% | |
| Other | 0.8% | |
| Jackson | Obama | 28.2% | |
| Romney | 70.0% | |
| Other | 1.8% | |
| Jefferson | Obama | 52.5% | |
| Romney | 46.5% | |
| Other | 1.0% | |
| Lamar | Obama | 22.9% | |
| Romney | 76.0% | |
| Other | 1.0% | |
| Lauderdale | Obama | 33.8% | |
| Romney | 64.6% | |
| Other | 1.6% | |
| Lawrence | Obama | 35.8% | |
| Romney | 62.7% | |
| Other | 1.4% | |
| Lee | Obama | 39.2% | |
| Romney | 59.1% | |
| Other | 1.7% | |
| Limestone | Obama | 27.7% | |
| Romney | 71.2% | |
| Other | 1.2% | |
| Lowndes | Obama | 76.4% | |
| Romney | 23.3% | |
| Other | 0.3% | |
| Macon | Obama | 87.0% | |
| Romney | 12.8% | |
| Other | 0.2% | |
| Madison | Obama | 39.9% | |
| Romney | 58.5% | |
| Other | 1.6% | |
| Marengo | Obama | 53.4% | |
| Romney | 46.2% | |
| Other | 0.3% | |
| Marion | Obama | 18.5% | |
| Romney | 79.9% | |
| Other | 1.5% | |
| Marshall | Obama | 19.3% | |
| Romney | 79.2% | |
| Other | 1.5% | |
| Mobile | Obama | 45.0% | |
| Romney | 54.2% | |
| Other | 0.8% | |
| Monroe | Obama | 45.9% | |
| Romney | 53.6% | |
| Other | 0.6% | |
| Montgomery | Obama | 61.8% | |
| Romney | 37.6% | |
| Other | 0.6% | |
| Morgan | Obama | 27.2% | |
| Romney | 71.6% | |
| Other | 1.3% | |
| Perry | Obama | 74.9% | |
| Romney | 24.7% | |
| Other | 0.4% | |
| Pickens | Obama | 46.3% | |
| Romney | 53.3% | |
| Other | 0.4% | |
| Pike | Obama | 42.7% | |
| Romney | 56.4% | |
| Other | 0.9% | |
| Randolph | Obama | 29.5% | |
| Romney | 69.3% | |
| Other | 1.1% | |
| Russell | Obama | 55.5% | |
| Romney | 43.8% | |
| Other | 0.7% | |
| St. Clair | Obama | 16.5% | |
| Romney | 82.4% | |
| Other | 1.1% | |
| Shelby | Obama | 21.6% | |
| Romney | 77.0% | |
| Other | 1.4% | |
| Sumter | Obama | 77.1% | |
| Romney | 22.6% | |
| Other | 0.3% | |
| Talladega | Obama | 41.6% | |
| Romney | 57.6% | |
| Other | 0.8% | |
| Tallapoosa | Obama | 33.5% | |
| Romney | 65.8% | |
| Other | 0.7% | |
| Tuscaloosa | Obama | 40.7% | |
| Romney | 58.1% | |
| Other | 1.2% | |
| Walker | Obama | 22.9% | |
| Romney | 75.7% | |
| Other | 1.3% | |
| Washington | Obama | 33.9% | |
| Romney | 65.6% | |
| Other | 0.6% | |
| Wilcox | Obama | 74.3% | |
| Romney | 25.6% | |
| Other | 0.1% | |
| Winston | Obama | 13.2% | |
| Romney | 85.4% | |
| Other | 1.3% | |