2012 Presidential General Election Data Graphs - Kentucky
Note: The Google advertisement links below may advocate political positions that this site does not endorse.
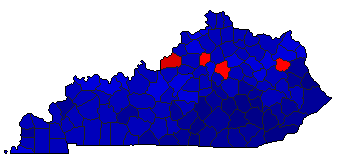
Map

AdairObama21.8%
 
Romney76.9%
 
Other1.3%


AllenObama25.5%
 
Romney73.0%
 
Other1.5%


AndersonObama32.1%
 
Romney66.1%
 
Other1.8%


BallardObama30.5%
 
Romney68.0%
 
Other1.5%


BarrenObama32.6%
 
Romney65.9%
 
Other1.5%


BathObama42.9%
 
Romney55.2%
 
Other1.9%


BellObama23.5%
 
Romney75.2%
 
Other1.4%


BooneObama29.8%
 
Romney68.4%
 
Other1.8%


BourbonObama38.8%
 
Romney59.2%
 
Other2.0%


BoydObama40.8%
 
Romney57.1%
 
Other2.0%


BoyleObama36.1%
 
Romney62.3%
 
Other1.6%


BrackenObama35.5%
 
Romney62.8%
 
Other1.7%


BreathittObama31.2%
 
Romney66.3%
 
Other2.6%


BreckinridgeObama35.4%
 
Romney63.1%
 
Other1.5%


BullittObama31.4%
 
Romney67.0%
 
Other1.6%


ButlerObama25.6%
 
Romney73.4%
 
Other1.0%


CaldwellObama31.6%
 
Romney66.6%
 
Other1.8%


CallowayObama35.3%
 
Romney62.6%
 
Other2.1%


CampbellObama37.5%
 
Romney60.3%
 
Other2.1%


CarlisleObama28.6%
 
Romney70.1%
 
Other1.3%


CarrollObama44.3%
 
Romney54.3%
 
Other1.4%


CarterObama38.0%
 
Romney59.3%
 
Other2.8%


CaseyObama17.8%
 
Romney80.5%
 
Other1.7%


ChristianObama37.6%
 
Romney61.4%
 
Other1.0%


ClarkObama33.9%
 
Romney64.4%
 
Other1.7%


ClayObama15.0%
 
Romney83.7%
 
Other1.3%


ClintonObama17.1%
 
Romney81.2%
 
Other1.6%


CrittendenObama24.9%
 
Romney73.7%
 
Other1.4%


CumberlandObama21.0%
 
Romney77.6%
 
Other1.4%


DaviessObama38.5%
 
Romney59.6%
 
Other1.9%


EdmonsonObama29.4%
 
Romney69.2%
 
Other1.3%


ElliottObama49.4%
 
Romney46.9%
 
Other3.6%


EstillObama26.2%
 
Romney72.3%
 
Other1.5%


FayetteObama49.3%
 
Romney48.3%
 
Other2.4%


FlemingObama33.1%
 
Romney65.4%
 
Other1.6%


FloydObama31.8%
 
Romney65.7%
 
Other2.5%


FranklinObama49.4%
 
Romney48.6%
 
Other2.0%


FultonObama41.2%
 
Romney57.4%
 
Other1.4%


GallatinObama40.4%
 
Romney57.4%
 
Other2.1%


GarrardObama23.5%
 
Romney75.0%
 
Other1.5%


GrantObama32.6%
 
Romney65.8%
 
Other1.6%


GravesObama29.3%
 
Romney69.0%
 
Other1.7%


GraysonObama29.6%
 
Romney69.1%
 
Other1.3%


GreenObama24.0%
 
Romney74.8%
 
Other1.2%


GreenupObama39.7%
 
Romney58.4%
 
Other1.9%


HancockObama44.3%
 
Romney53.5%
 
Other2.2%


HardinObama38.8%
 
Romney59.6%
 
Other1.6%


HarlanObama17.2%
 
Romney81.2%
 
Other1.6%


HarrisonObama34.5%
 
Romney63.6%
 
Other1.9%


HartObama34.5%
 
Romney64.3%
 
Other1.2%


HendersonObama43.4%
 
Romney55.3%
 
Other1.3%


HenryObama38.4%
 
Romney59.8%
 
Other1.8%


HickmanObama32.1%
 
Romney66.9%
 
Other1.0%


HopkinsObama29.3%
 
Romney69.2%
 
Other1.5%


JacksonObama12.1%
 
Romney86.2%
 
Other1.7%


JeffersonObama54.7%
 
Romney43.6%
 
Other1.7%


JessamineObama29.1%
 
Romney69.0%
 
Other1.9%


JohnsonObama19.1%
 
Romney78.5%
 
Other2.4%


KentonObama36.8%
 
Romney61.1%
 
Other2.1%


KnottObama24.9%
 
Romney72.5%
 
Other2.5%


KnoxObama22.4%
 
Romney76.3%
 
Other1.3%


LarueObama30.1%
 
Romney67.9%
 
Other2.1%


LaurelObama17.4%
 
Romney81.0%
 
Other1.6%


LawrenceObama27.2%
 
Romney71.4%
 
Other1.4%


LeeObama22.7%
 
Romney75.4%
 
Other1.9%


LeslieObama8.7%
 
Romney89.6%
 
Other1.6%


LetcherObama19.4%
 
Romney77.8%
 
Other2.8%


LewisObama28.1%
 
Romney69.7%
 
Other2.1%


LincolnObama28.2%
 
Romney70.1%
 
Other1.7%


LivingstonObama29.8%
 
Romney68.5%
 
Other1.7%


LoganObama33.0%
 
Romney65.6%
 
Other1.4%


LyonObama35.8%
 
Romney62.8%
 
Other1.4%


McCrackenObama32.9%
 
Romney65.4%
 
Other1.7%


McCrearyObama18.7%
 
Romney80.0%
 
Other1.3%


McLeanObama34.1%
 
Romney64.4%
 
Other1.5%


MadisonObama34.5%
 
Romney63.4%
 
Other2.0%


MagoffinObama29.2%
 
Romney69.1%
 
Other1.7%


MarionObama46.7%
 
Romney51.9%
 
Other1.4%


MarshallObama31.9%
 
Romney66.2%
 
Other1.9%


MartinObama15.0%
 
Romney83.2%
 
Other1.8%


MasonObama37.7%
 
Romney61.0%
 
Other1.3%


MeadeObama37.8%
 
Romney60.5%
 
Other1.7%


MenifeeObama40.3%
 
Romney57.1%
 
Other2.5%


MercerObama29.8%
 
Romney68.6%
 
Other1.5%


MetcalfeObama34.1%
 
Romney64.0%
 
Other2.0%


MonroeObama19.7%
 
Romney79.3%
 
Other1.0%


MontgomeryObama36.1%
 
Romney62.4%
 
Other1.5%


MorganObama30.6%
 
Romney67.6%
 
Other1.8%


MuhlenbergObama37.5%
 
Romney60.9%
 
Other1.6%


NelsonObama41.1%
 
Romney57.6%
 
Other1.3%


NicholasObama36.7%
 
Romney61.3%
 
Other1.9%


OhioObama31.0%
 
Romney67.1%
 
Other2.0%


OldhamObama30.9%
 
Romney67.5%
 
Other1.6%


OwenObama32.9%
 
Romney65.2%
 
Other1.9%


OwsleyObama17.9%
 
Romney80.9%
 
Other1.1%


PendletonObama33.6%
 
Romney64.3%
 
Other2.2%


PerryObama20.0%
 
Romney78.5%
 
Other1.5%


PikeObama23.9%
 
Romney74.4%
 
Other1.7%


PowellObama36.2%
 
Romney61.7%
 
Other2.1%


PulaskiObama19.1%
 
Romney79.7%
 
Other1.2%


RobertsonObama36.4%
 
Romney61.9%
 
Other1.7%


RockcastleObama17.6%
 
Romney80.9%
 
Other1.5%


RowanObama44.9%
 
Romney52.6%
 
Other2.5%


RussellObama18.3%
 
Romney80.2%
 
Other1.5%


ScottObama36.6%
 
Romney61.6%
 
Other1.8%


ShelbyObama35.5%
 
Romney63.2%
 
Other1.3%


SimpsonObama37.4%
 
Romney61.4%
 
Other1.2%


SpencerObama30.2%
 
Romney67.9%
 
Other1.9%


TaylorObama30.0%
 
Romney69.0%
 
Other1.0%


ToddObama29.7%
 
Romney68.8%
 
Other1.4%


TriggObama31.4%
 
Romney67.0%
 
Other1.6%


TrimbleObama38.2%
 
Romney60.2%
 
Other1.6%


UnionObama32.5%
 
Romney66.1%
 
Other1.4%


WarrenObama38.3%
 
Romney60.1%
 
Other1.6%


WashingtonObama32.0%
 
Romney67.0%
 
Other1.1%


WayneObama25.7%
 
Romney73.4%
 
Other0.9%


WebsterObama32.3%
 
Romney65.9%
 
Other1.8%


WhitleyObama20.5%
 
Romney78.3%
 
Other1.2%


WolfeObama38.1%
 
Romney60.3%
 
Other1.6%


WoodfordObama39.6%
 
Romney58.5%
 
Other1.9%


National DataGraph for 2012 - Kentucky Results for 2012

Login

Terms of Use - DCMA Policy - Privacy Policy and Cookies


© Dave Leip's Atlas of U.S. Elections, LLC 2019 All Rights Reserved