2012 Presidential General Election Data Graphs - Massachusetts
by County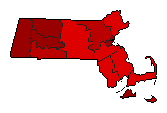
| Barnstable | Obama | 53.2% | |
| Romney | 45.4% | |
| Other | 1.4% | |
| Berkshire | Obama | 75.7% | |
| Romney | 22.1% | |
| Other | 2.2% | |
| Bristol | Obama | 59.4% | |
| Romney | 38.9% | |
| Other | 1.7% | |
| Dukes | Obama | 72.7% | |
| Romney | 25.5% | |
| Other | 1.8% | |
| Essex | Obama | 57.4% | |
| Romney | 41.1% | |
| Other | 1.5% | |
| Franklin | Obama | 71.7% | |
| Romney | 24.7% | |
| Other | 3.6% | |
| Hampden | Obama | 61.7% | |
| Romney | 36.6% | |
| Other | 1.7% | |
| Hampshire | Obama | 70.3% | |
| Romney | 26.3% | |
| Other | 3.4% | |
| Middlesex | Obama | 62.6% | |
| Romney | 35.4% | |
| Other | 2.0% | |
| Nantucket | Obama | 62.6% | |
| Romney | 35.7% | |
| Other | 1.7% | |
| Norfolk | Obama | 56.9% | |
| Romney | 41.6% | |
| Other | 1.5% | |
| Plymouth | Obama | 51.4% | |
| Romney | 47.2% | |
| Other | 1.4% | |
| Suffolk | Obama | 77.4% | |
| Romney | 20.8% | |
| Other | 1.8% | |
| Worcester | Obama | 53.7% | |
| Romney | 44.3% | |
| Other | 2.0% | |