2012 Senatorial General Election Data Graphs - Massachusetts
by County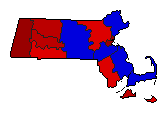
| Barnstable | Warren | 47.6% | |
| Brown | 52.4% | |
| 0.0% | |
| Other | 0.0% | |
| Berkshire | Warren | 70.7% | |
| Brown | 29.2% | |
| 0.0% | |
| Other | 0.1% | |
| Bristol | Warren | 52.4% | |
| Brown | 47.6% | |
| 0.0% | |
| Other | 0.0% | |
| Dukes | Warren | 67.7% | |
| Brown | 32.3% | |
| 0.0% | |
| Other | 0.0% | |
| Essex | Warren | 49.5% | |
| Brown | 50.4% | |
| 0.0% | |
| Other | 0.1% | |
| Franklin | Warren | 66.7% | |
| Brown | 33.2% | |
| 0.0% | |
| Other | 0.1% | |
| Hampden | Warren | 54.4% | |
| Brown | 45.5% | |
| 0.0% | |
| Other | 0.1% | |
| Hampshire | Warren | 65.7% | |
| Brown | 34.2% | |
| 0.0% | |
| Other | 0.1% | |
| Middlesex | Warren | 55.9% | |
| Brown | 44.0% | |
| 0.0% | |
| Other | 0.1% | |
| Nantucket | Warren | 56.4% | |
| Brown | 43.6% | |
| 0.0% | |
| Other | 0.0% | |
| Norfolk | Warren | 49.0% | |
| Brown | 50.9% | |
| 0.0% | |
| Other | 0.1% | |
| Plymouth | Warren | 43.6% | |
| Brown | 56.3% | |
| 0.0% | |
| Other | 0.1% | |
| Suffolk | Warren | 72.6% | |
| Brown | 27.3% | |
| 0.0% | |
| Other | 0.1% | |
| Worcester | Warren | 45.8% | |
| Brown | 54.2% | |
| 0.0% | |
| Other | 0.1% | |