2012 Presidential General Election Data Graphs - Minnesota
Note: The Google advertisement links below may advocate political positions that this site does not endorse.
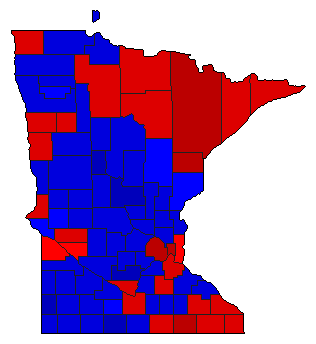
Map

AitkinObama48.3%
 
Romney49.6%
 
Other2.2%


AnokaObama47.5%
 
Romney50.1%
 
Other2.4%


BeckerObama41.7%
 
Romney56.2%
 
Other2.1%


BeltramiObama53.6%
 
Romney43.7%
 
Other2.7%


BentonObama41.7%
 
Romney55.3%
 
Other3.0%


Big StoneObama48.2%
 
Romney49.7%
 
Other2.1%


Blue EarthObama53.0%
 
Romney43.5%
 
Other3.5%


BrownObama40.4%
 
Romney57.0%
 
Other2.6%


CarltonObama61.8%
 
Romney35.7%
 
Other2.5%


CarverObama39.2%
 
Romney58.9%
 
Other1.9%


CassObama42.5%
 
Romney55.5%
 
Other2.0%


ChippewaObama49.7%
 
Romney47.8%
 
Other2.4%


ChisagoObama42.5%
 
Romney55.1%
 
Other2.3%


ClayObama52.6%
 
Romney44.7%
 
Other2.6%


ClearwaterObama41.8%
 
Romney56.2%
 
Other2.0%


CookObama60.0%
 
Romney36.8%
 
Other3.3%


CottonwoodObama41.5%
 
Romney56.6%
 
Other1.9%


Crow WingObama42.3%
 
Romney55.6%
 
Other2.1%


DakotaObama50.4%
 
Romney47.4%
 
Other2.2%


DodgeObama43.4%
 
Romney53.5%
 
Other3.1%


DouglasObama41.3%
 
Romney56.7%
 
Other2.0%


FaribaultObama44.2%
 
Romney53.2%
 
Other2.6%


FillmoreObama52.5%
 
Romney45.1%
 
Other2.4%


FreebornObama55.8%
 
Romney41.7%
 
Other2.5%


GoodhueObama47.3%
 
Romney50.3%
 
Other2.3%


GrantObama47.2%
 
Romney50.1%
 
Other2.6%


HennepinObama62.3%
 
Romney35.3%
 
Other2.4%


HoustonObama50.6%
 
Romney47.4%
 
Other2.0%


HubbardObama40.6%
 
Romney57.5%
 
Other1.9%


IsantiObama39.7%
 
Romney57.7%
 
Other2.6%


ItascaObama53.7%
 
Romney43.9%
 
Other2.4%


JacksonObama41.8%
 
Romney56.1%
 
Other2.2%


KanabecObama44.1%
 
Romney53.1%
 
Other2.8%


KandiyohiObama45.7%
 
Romney52.4%
 
Other2.0%


KittsonObama51.3%
 
Romney45.2%
 
Other3.5%


KoochichingObama53.4%
 
Romney44.0%
 
Other2.6%


Lac Qui ParleObama49.5%
 
Romney48.6%
 
Other1.8%


LakeObama59.3%
 
Romney38.3%
 
Other2.4%


Lake of the WoodsObama38.5%
 
Romney58.5%
 
Other3.1%


Le SueurObama45.6%
 
Romney52.1%
 
Other2.2%


LincolnObama45.8%
 
Romney51.1%
 
Other3.1%


LyonObama44.1%
 
Romney53.2%
 
Other2.7%


McLeodObama37.6%
 
Romney59.7%
 
Other2.8%


MahnomenObama58.5%
 
Romney39.9%
 
Other1.6%


MarshallObama42.5%
 
Romney54.7%
 
Other2.8%


MartinObama37.0%
 
Romney60.7%
 
Other2.3%


MeekerObama40.7%
 
Romney56.6%
 
Other2.7%


Mille LacsObama44.5%
 
Romney53.1%
 
Other2.4%


MorrisonObama36.8%
 
Romney60.8%
 
Other2.4%


MowerObama60.0%
 
Romney37.4%
 
Other2.5%


MurrayObama45.3%
 
Romney52.5%
 
Other2.2%


NicolletObama52.6%
 
Romney44.7%
 
Other2.7%


NoblesObama44.5%
 
Romney53.8%
 
Other1.7%


NormanObama53.9%
 
Romney43.2%
 
Other2.9%


OlmstedObama50.2%
 
Romney47.0%
 
Other2.7%


Otter TailObama38.4%
 
Romney59.6%
 
Other2.0%


PenningtonObama46.4%
 
Romney50.7%
 
Other2.9%


PineObama48.3%
 
Romney49.0%
 
Other2.6%


PipestoneObama37.1%
 
Romney60.8%
 
Other2.0%


PolkObama46.1%
 
Romney51.8%
 
Other2.1%


PopeObama47.7%
 
Romney50.3%
 
Other2.0%


RamseyObama66.3%
 
Romney31.1%
 
Other2.5%


Red LakeObama47.0%
 
Romney49.5%
 
Other3.5%


RedwoodObama38.6%
 
Romney58.7%
 
Other2.7%


RenvilleObama44.0%
 
Romney53.8%
 
Other2.2%


RiceObama52.9%
 
Romney44.6%
 
Other2.6%


RockObama40.2%
 
Romney58.0%
 
Other1.9%


RoseauObama37.7%
 
Romney60.0%
 
Other2.3%


St. LouisObama63.5%
 
Romney33.9%
 
Other2.7%


ScottObama41.5%
 
Romney56.3%
 
Other2.2%


SherburneObama37.8%
 
Romney59.9%
 
Other2.3%


SibleyObama37.3%
 
Romney60.1%
 
Other2.6%


StearnsObama42.8%
 
Romney54.8%
 
Other2.4%


SteeleObama45.5%
 
Romney51.8%
 
Other2.7%


StevensObama48.5%
 
Romney48.9%
 
Other2.5%


SwiftObama53.7%
 
Romney43.9%
 
Other2.3%


ToddObama40.8%
 
Romney56.9%
 
Other2.2%


TraverseObama51.1%
 
Romney46.6%
 
Other2.3%


WabashaObama46.0%
 
Romney51.4%
 
Other2.5%


WadenaObama36.7%
 
Romney61.0%
 
Other2.3%


WasecaObama44.8%
 
Romney52.5%
 
Other2.7%


WashingtonObama49.4%
 
Romney48.6%
 
Other2.0%


WatonwanObama48.5%
 
Romney48.9%
 
Other2.6%


WilkinObama39.0%
 
Romney58.5%
 
Other2.5%


WinonaObama55.0%
 
Romney42.2%
 
Other2.8%


WrightObama38.0%
 
Romney59.7%
 
Other2.4%


Yellow MedicineObama45.5%
 
Romney51.8%
 
Other2.6%


National DataGraph for 2012 - Minnesota Results for 2012

Login

Terms of Use - DCMA Policy - Privacy Policy and Cookies


© Dave Leip's Atlas of U.S. Elections, LLC 2019 All Rights Reserved