2012 Presidential General Election Data Graphs - Arizona
by County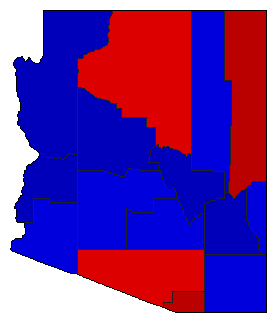
| Apache | Obama | 66.2% | |
| Romney | 31.8% | |
| Other | 2.0% | |
| Cochise | Obama | 37.7% | |
| Romney | 60.0% | |
| Other | 2.4% | |
| Coconino | Obama | 56.3% | |
| Romney | 40.8% | |
| Other | 2.9% | |
| Gila | Obama | 35.6% | |
| Romney | 62.3% | |
| Other | 2.1% | |
| Graham | Obama | 30.3% | |
| Romney | 67.8% | |
| Other | 1.8% | |
| Greenlee | Obama | 43.9% | |
| Romney | 53.3% | |
| Other | 2.8% | |
| La Paz | Obama | 32.8% | |
| Romney | 64.8% | |
| Other | 2.5% | |
| Maricopa | Obama | 43.6% | |
| Romney | 54.3% | |
| Other | 2.1% | |
| Mohave | Obama | 27.8% | |
| Romney | 69.9% | |
| Other | 2.3% | |
| Navajo | Obama | 45.2% | |
| Romney | 53.1% | |
| Other | 1.7% | |
| Pima | Obama | 52.5% | |
| Romney | 45.6% | |
| Other | 1.9% | |
| Pinal | Obama | 40.8% | |
| Romney | 57.1% | |
| Other | 2.1% | |
| Santa Cruz | Obama | 68.2% | |
| Romney | 30.4% | |
| Other | 1.4% | |
| Yavapai | Obama | 33.7% | |
| Romney | 64.0% | |
| Other | 2.3% | |
| Yuma | Obama | 42.9% | |
| Romney | 55.5% | |
| Other | 1.6% | |