2012 Senatorial General Election Data Graphs - Arizona
by County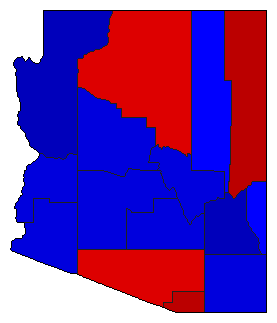
| Apache | Carmona | 65.1% | |
| Flake | 30.4% | |
| 0.0% | |
| Other | 4.5% | |
| Cochise | Carmona | 40.9% | |
| Flake | 54.3% | |
| 0.0% | |
| Other | 4.9% | |
| Coconino | Carmona | 56.6% | |
| Flake | 38.1% | |
| 0.0% | |
| Other | 5.2% | |
| Gila | Carmona | 38.2% | |
| Flake | 56.4% | |
| 0.0% | |
| Other | 5.4% | |
| Graham | Carmona | 32.2% | |
| Flake | 62.8% | |
| 0.0% | |
| Other | 5.0% | |
| Greenlee | Carmona | 46.1% | |
| Flake | 46.9% | |
| 0.0% | |
| Other | 7.0% | |
| La Paz | Carmona | 35.6% | |
| Flake | 56.6% | |
| 0.0% | |
| Other | 7.8% | |
| Maricopa | Carmona | 44.9% | |
| Flake | 50.3% | |
| 0.0% | |
| Other | 4.8% | |
| Mohave | Carmona | 30.6% | |
| Flake | 62.2% | |
| 0.0% | |
| Other | 7.2% | |
| Navajo | Carmona | 45.9% | |
| Flake | 49.6% | |
| 0.0% | |
| Other | 4.5% | |
| Pima | Carmona | 55.5% | |
| Flake | 41.1% | |
| 0.0% | |
| Other | 3.4% | |
| Pinal | Carmona | 42.8% | |
| Flake | 51.6% | |
| 0.0% | |
| Other | 5.6% | |
| Santa Cruz | Carmona | 69.9% | |
| Flake | 26.7% | |
| 0.0% | |
| Other | 3.3% | |
| Yavapai | Carmona | 35.6% | |
| Flake | 59.0% | |
| 0.0% | |
| Other | 5.3% | |
| Yuma | Carmona | 45.4% | |
| Flake | 51.8% | |
| 0.0% | |
| Other | 2.8% | |