2012 Gubernatorial General Election Data Graphs - Utah
by County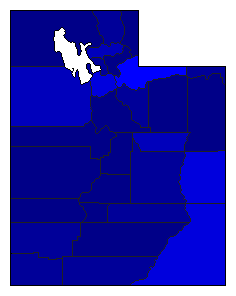
| Beaver | Cooke | 15.5% | |
| Herbert | 80.9% | |
| 0.0% | |
| Other | 3.6% | |
| Box Elder | Cooke | 14.4% | |
| Herbert | 82.0% | |
| 0.0% | |
| Other | 3.6% | |
| Cache | Cooke | 18.2% | |
| Herbert | 77.1% | |
| 0.0% | |
| Other | 4.7% | |
| Carbon | Cooke | 33.1% | |
| Herbert | 63.4% | |
| 0.0% | |
| Other | 3.5% | |
| Daggett | Cooke | 18.9% | |
| Herbert | 76.6% | |
| 0.0% | |
| Other | 4.5% | |
| Davis | Cooke | 22.3% | |
| Herbert | 74.2% | |
| 0.0% | |
| Other | 3.5% | |
| Duchesne | Cooke | 10.9% | |
| Herbert | 85.3% | |
| 0.0% | |
| Other | 3.8% | |
| Emery | Cooke | 16.4% | |
| Herbert | 79.6% | |
| 0.0% | |
| Other | 4.0% | |
| Garfield | Cooke | 15.5% | |
| Herbert | 81.6% | |
| 0.0% | |
| Other | 2.9% | |
| Grand | Cooke | 43.7% | |
| Herbert | 51.0% | |
| 0.0% | |
| Other | 5.3% | |
| Iron | Cooke | 14.9% | |
| Herbert | 79.3% | |
| 0.0% | |
| Other | 5.7% | |
| Juab | Cooke | 14.9% | |
| Herbert | 80.8% | |
| 0.0% | |
| Other | 4.2% | |
| Kane | Cooke | 21.4% | |
| Herbert | 74.2% | |
| 0.0% | |
| Other | 4.4% | |
| Millard | Cooke | 14.0% | |
| Herbert | 80.7% | |
| 0.0% | |
| Other | 5.3% | |
| Morgan | Cooke | 15.3% | |
| Herbert | 81.1% | |
| 0.0% | |
| Other | 3.5% | |
| Piute | Cooke | 10.7% | |
| Herbert | 86.0% | |
| 0.0% | |
| Other | 3.3% | |
| Rich | Cooke | 12.4% | |
| Herbert | 85.2% | |
| 0.0% | |
| Other | 2.4% | |
| Salt Lake | Cooke | 40.8% | |
| Herbert | 55.4% | |
| 0.0% | |
| Other | 3.8% | |
| San Juan | Cooke | 37.0% | |
| Herbert | 59.0% | |
| 0.0% | |
| Other | 4.0% | |
| Sanpete | Cooke | 14.6% | |
| Herbert | 80.9% | |
| 0.0% | |
| Other | 4.5% | |
| Sevier | Cooke | 13.0% | |
| Herbert | 82.9% | |
| 0.0% | |
| Other | 4.1% | |
| Summit | Cooke | 46.8% | |
| Herbert | 49.7% | |
| 0.0% | |
| Other | 3.5% | |
| Tooele | Cooke | 26.0% | |
| Herbert | 68.5% | |
| 0.0% | |
| Other | 5.4% | |
| Uintah | Cooke | 9.6% | |
| Herbert | 86.8% | |
| 0.0% | |
| Other | 3.6% | |
| Utah | Cooke | 12.9% | |
| Herbert | 82.8% | |
| 0.0% | |
| Other | 4.3% | |
| Wasatch | Cooke | 24.7% | |
| Herbert | 71.8% | |
| 0.0% | |
| Other | 3.5% | |
| Washington | Cooke | 17.3% | |
| Herbert | 78.4% | |
| 0.0% | |
| Other | 4.3% | |
| Wayne | Cooke | 18.1% | |
| Herbert | 79.7% | |
| 0.0% | |
| Other | 2.2% | |
| Weber | Cooke | 28.4% | |
| Herbert | 67.5% | |
| 0.0% | |
| Other | 4.1% | |