2012 Presidential General Election Data Graphs - Virginia
Note: The Google advertisement links below may advocate political positions that this site does not endorse.
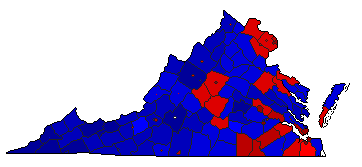
Map

AccomackObama47.7%
 
Romney51.2%
 
Other1.1%


AlbemarleObama55.2%
 
Romney43.2%
 
Other1.6%


AlleghanyObama47.4%
 
Romney50.1%
 
Other2.4%


AmeliaObama36.0%
 
Romney62.6%
 
Other1.4%


AmherstObama39.4%
 
Romney59.3%
 
Other1.3%


AppomattoxObama30.9%
 
Romney67.3%
 
Other1.8%


ArlingtonObama69.1%
 
Romney29.3%
 
Other1.6%


AugustaObama28.1%
 
Romney70.2%
 
Other1.8%


BathObama40.2%
 
Romney57.3%
 
Other2.5%


BedfordObama27.3%
 
Romney71.3%
 
Other1.4%


BlandObama24.9%
 
Romney72.7%
 
Other2.3%


BotetourtObama29.9%
 
Romney68.4%
 
Other1.7%


BrunswickObama62.1%
 
Romney36.9%
 
Other0.9%


BuchananObama32.1%
 
Romney66.7%
 
Other1.2%


BuckinghamObama50.3%
 
Romney47.9%
 
Other1.9%


CampbellObama29.6%
 
Romney68.9%
 
Other1.6%


CarolineObama53.3%
 
Romney45.1%
 
Other1.6%


CarrollObama28.5%
 
Romney67.6%
 
Other3.8%


Charles CityObama65.5%
 
Romney33.0%
 
Other1.5%


CharlotteObama42.4%
 
Romney56.1%
 
Other1.4%


ChesterfieldObama45.4%
 
Romney53.2%
 
Other1.4%


ClarkeObama41.7%
 
Romney55.3%
 
Other2.9%


CraigObama31.1%
 
Romney65.9%
 
Other3.0%


CulpeperObama41.0%
 
Romney57.3%
 
Other1.7%


CumberlandObama48.0%
 
Romney50.3%
 
Other1.7%


DickensonObama35.8%
 
Romney61.9%
 
Other2.3%


DinwiddieObama48.2%
 
Romney50.6%
 
Other1.2%


EssexObama53.1%
 
Romney45.9%
 
Other1.0%


FairfaxObama59.6%
 
Romney39.1%
 
Other1.4%


FauquierObama39.3%
 
Romney59.2%
 
Other1.6%


FloydObama35.7%
 
Romney61.1%
 
Other3.1%


FluvannaObama46.2%
 
Romney52.4%
 
Other1.4%


FranklinObama34.0%
 
Romney62.6%
 
Other3.4%


FrederickObama34.9%
 
Romney62.8%
 
Other2.3%


GilesObama36.1%
 
Romney61.7%
 
Other2.2%


GloucesterObama35.1%
 
Romney62.9%
 
Other2.0%


GoochlandObama35.1%
 
Romney63.4%
 
Other1.4%


GraysonObama29.0%
 
Romney67.4%
 
Other3.5%


GreeneObama36.5%
 
Romney61.7%
 
Other1.8%


GreensvilleObama63.6%
 
Romney35.9%
 
Other0.5%


HalifaxObama46.5%
 
Romney52.1%
 
Other1.4%


HanoverObama31.0%
 
Romney67.6%
 
Other1.4%


HenricoObama55.2%
 
Romney43.4%
 
Other1.4%


HenryObama41.3%
 
Romney56.0%
 
Other2.7%


HighlandObama32.5%
 
Romney65.4%
 
Other2.1%


Isle of WightObama42.1%
 
Romney56.7%
 
Other1.3%


James CityObama43.4%
 
Romney55.4%
 
Other1.3%


King and QueenObama47.7%
 
Romney51.0%
 
Other1.2%


King GeorgeObama39.5%
 
Romney58.3%
 
Other2.2%


King WilliamObama37.5%
 
Romney61.3%
 
Other1.3%


LancasterObama45.2%
 
Romney53.9%
 
Other0.8%


LeeObama26.9%
 
Romney71.3%
 
Other1.8%


LoudounObama51.5%
 
Romney47.0%
 
Other1.4%


LouisaObama42.3%
 
Romney56.0%
 
Other1.7%


LunenburgObama46.8%
 
Romney51.8%
 
Other1.4%


MadisonObama39.9%
 
Romney58.5%
 
Other1.6%


MathewsObama33.6%
 
Romney64.9%
 
Other1.5%


MecklenburgObama45.9%
 
Romney52.9%
 
Other1.2%


MiddlesexObama39.0%
 
Romney59.5%
 
Other1.5%


MontgomeryObama48.5%
 
Romney48.8%
 
Other2.7%


NelsonObama50.6%
 
Romney47.8%
 
Other1.6%


New KentObama32.5%
 
Romney66.2%
 
Other1.4%


NorthamptonObama57.6%
 
Romney41.2%
 
Other1.1%


NorthumberlandObama42.2%
 
Romney57.0%
 
Other0.8%


NottowayObama48.8%
 
Romney49.8%
 
Other1.4%


OrangeObama42.0%
 
Romney56.5%
 
Other1.5%


PageObama36.4%
 
Romney62.0%
 
Other1.6%


PatrickObama29.3%
 
Romney68.1%
 
Other2.7%


PittsylvaniaObama35.4%
 
Romney62.8%
 
Other1.8%


PowhatanObama26.3%
 
Romney72.1%
 
Other1.5%


Prince EdwardObama55.5%
 
Romney42.8%
 
Other1.7%


Prince GeorgeObama43.6%
 
Romney55.3%
 
Other1.1%


Prince WilliamObama57.3%
 
Romney41.3%
 
Other1.3%


PulaskiObama36.0%
 
Romney60.8%
 
Other3.2%


RappahannockObama45.4%
 
Romney53.0%
 
Other1.5%


RichmondObama41.8%
 
Romney57.3%
 
Other1.0%


RoanokeObama36.5%
 
Romney61.7%
 
Other1.7%


RockbridgeObama40.2%
 
Romney58.0%
 
Other1.9%


RockinghamObama28.9%
 
Romney69.4%
 
Other1.8%


RussellObama30.8%
 
Romney67.7%
 
Other1.6%


ScottObama24.0%
 
Romney74.4%
 
Other1.6%


ShenandoahObama33.4%
 
Romney64.7%
 
Other1.9%


SmythObama32.6%
 
Romney65.6%
 
Other1.8%


SouthamptonObama47.9%
 
Romney51.1%
 
Other1.0%


SpotsylvaniaObama43.4%
 
Romney54.9%
 
Other1.7%


StaffordObama44.9%
 
Romney53.6%
 
Other1.5%


SurryObama59.8%
 
Romney38.8%
 
Other1.4%


SussexObama61.7%
 
Romney37.2%
 
Other1.1%


TazewellObama20.6%
 
Romney78.1%
 
Other1.3%


WarrenObama38.6%
 
Romney59.1%
 
Other2.3%


WashingtonObama27.6%
 
Romney70.8%
 
Other1.6%


WestmorelandObama52.9%
 
Romney45.9%
 
Other1.2%


WiseObama25.0%
 
Romney73.8%
 
Other1.2%


WytheObama30.6%
 
Romney67.4%
 
Other2.0%


YorkObama38.8%
 
Romney59.5%
 
Other1.7%


City

AlexandriaObama71.1%
 
Romney27.6%
 
Other1.3%


BedfordObama43.7%
 
Romney54.4%
 
Other1.9%


BristolObama33.7%
 
Romney64.7%
 
Other1.6%


Buena VistaObama36.4%
 
Romney61.9%
 
Other1.7%


CharlottesvilleObama75.7%
 
Romney22.2%
 
Other2.0%


ChesapeakeObama49.9%
 
Romney48.8%
 
Other1.3%


Colonial HeightsObama29.5%
 
Romney68.9%
 
Other1.6%


CovingtonObama56.6%
 
Romney41.8%
 
Other1.5%


DanvilleObama60.5%
 
Romney38.4%
 
Other1.1%


EmporiaObama66.5%
 
Romney32.9%
 
Other0.6%


FairfaxObama57.2%
 
Romney41.1%
 
Other1.7%


Falls ChurchObama68.9%
 
Romney29.5%
 
Other1.6%


FranklinObama65.0%
 
Romney34.3%
 
Other0.7%


FredericksburgObama62.4%
 
Romney35.5%
 
Other2.2%


GalaxObama39.5%
 
Romney58.5%
 
Other2.0%


HamptonObama70.6%
 
Romney28.0%
 
Other1.3%


HarrisonburgObama55.5%
 
Romney42.1%
 
Other2.4%


HopewellObama57.3%
 
Romney41.4%
 
Other1.3%


LexingtonObama55.3%
 
Romney42.6%
 
Other2.0%


LynchburgObama43.8%
 
Romney54.3%
 
Other1.9%


ManassasObama55.8%
 
Romney42.5%
 
Other1.7%


Manassas ParkObama61.8%
 
Romney36.5%
 
Other1.7%


MartinsvilleObama61.3%
 
Romney36.8%
 
Other1.9%


Newport NewsObama64.3%
 
Romney34.3%
 
Other1.4%


NorfolkObama72.0%
 
Romney26.6%
 
Other1.4%


NortonObama37.9%
 
Romney60.0%
 
Other2.1%


PetersburgObama89.8%
 
Romney9.6%
 
Other0.6%


PoquosonObama23.6%
 
Romney74.8%
 
Other1.6%


PortsmouthObama70.8%
 
Romney28.0%
 
Other1.2%


RadfordObama50.6%
 
Romney46.7%
 
Other2.7%


RichmondObama77.8%
 
Romney20.5%
 
Other1.6%


RoanokeObama60.1%
 
Romney37.3%
 
Other2.6%


SalemObama38.6%
 
Romney59.3%
 
Other2.1%


StauntonObama51.1%
 
Romney47.0%
 
Other1.9%


SuffolkObama57.0%
 
Romney41.9%
 
Other1.1%


Virginia BeachObama48.0%
 
Romney50.5%
 
Other1.6%


WaynesboroObama43.7%
 
Romney54.5%
 
Other1.8%


WilliamsburgObama63.3%
 
Romney34.6%
 
Other2.1%


WinchesterObama49.5%
 
Romney48.0%
 
Other2.5%


National DataGraph for 2012 - Virginia Results for 2012

Login

Terms of Use - DCMA Policy - Privacy Policy and Cookies


© Dave Leip's Atlas of U.S. Elections, LLC 2019 All Rights Reserved