2012 State Auditor Open Runoff Election Data Graphs - Washington
Note: The Google advertisement links below may advocate political positions that this site does not endorse.
Data for this Contest was Contributed by on 2012-08-27
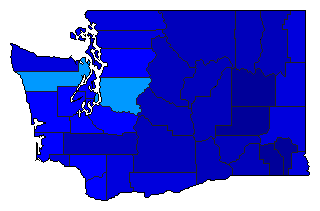
Map

AdamsKelley17.0%
 
Watkins72.3%
 
Pridemore7.0%
 
Other3.7%


AsotinKelley22.5%
 
Watkins58.2%
 
Pridemore12.7%
 
Other6.7%


BentonKelley15.2%
 
Watkins67.4%
 
Pridemore11.9%
 
Other5.5%


ChelanKelley17.5%
 
Watkins65.0%
 
Pridemore12.4%
 
Other5.0%


ClallamKelley20.4%
 
Watkins54.7%
 
Pridemore17.0%
 
Other8.0%


ClarkKelley10.3%
 
Watkins48.8%
 
Pridemore36.1%
 
Other4.8%


ColumbiaKelley13.7%
 
Watkins70.2%
 
Pridemore10.0%
 
Other6.1%


CowlitzKelley23.2%
 
Watkins48.8%
 
Pridemore20.2%
 
Other7.9%


DouglasKelley17.3%
 
Watkins67.3%
 
Pridemore10.2%
 
Other5.1%


FerryKelley18.7%
 
Watkins62.6%
 
Pridemore12.3%
 
Other6.4%


FranklinKelley16.2%
 
Watkins68.6%
 
Pridemore10.2%
 
Other5.0%


GarfieldKelley16.4%
 
Watkins71.4%
 
Pridemore6.8%
 
Other5.4%


GrantKelley17.4%
 
Watkins67.3%
 
Pridemore10.0%
 
Other5.2%


Grays HarborKelley27.2%
 
Watkins44.8%
 
Pridemore18.8%
 
Other9.2%


IslandKelley22.0%
 
Watkins52.1%
 
Pridemore18.7%
 
Other7.2%


JeffersonKelley22.8%
 
Watkins39.0%
 
Pridemore29.9%
 
Other8.3%


KingKelley25.3%
 
Watkins33.5%
 
Pridemore28.5%
 
Other12.6%


KitsapKelley25.5%
 
Watkins46.9%
 
Pridemore18.0%
 
Other9.6%


KittitasKelley18.7%
 
Watkins60.3%
 
Pridemore14.9%
 
Other6.1%


KlickitatKelley17.5%
 
Watkins57.6%
 
Pridemore18.2%
 
Other6.7%


LewisKelley15.6%
 
Watkins64.9%
 
Pridemore13.8%
 
Other5.7%


LincolnKelley15.0%
 
Watkins71.4%
 
Pridemore9.2%
 
Other4.5%


MasonKelley23.4%
 
Watkins49.6%
 
Pridemore17.6%
 
Other9.3%


OkanoganKelley18.6%
 
Watkins60.6%
 
Pridemore15.3%
 
Other5.4%


PacificKelley23.6%
 
Watkins45.7%
 
Pridemore22.4%
 
Other8.2%


Pend OreilleKelley20.2%
 
Watkins59.9%
 
Pridemore13.2%
 
Other6.8%


PierceKelley29.9%
 
Watkins45.5%
 
Pridemore12.3%
 
Other12.3%


San JuanKelley19.2%
 
Watkins40.4%
 
Pridemore32.1%
 
Other8.3%


SkagitKelley22.4%
 
Watkins51.9%
 
Pridemore17.7%
 
Other8.0%


SkamaniaKelley18.4%
 
Watkins52.4%
 
Pridemore22.9%
 
Other6.4%


SnohomishKelley24.8%
 
Watkins45.3%
 
Pridemore19.1%
 
Other10.9%


SpokaneKelley20.7%
 
Watkins56.0%
 
Pridemore15.5%
 
Other7.9%


StevensKelley15.7%
 
Watkins66.8%
 
Pridemore11.7%
 
Other5.8%


ThurstonKelley22.6%
 
Watkins43.1%
 
Pridemore24.3%
 
Other9.9%


WahkiakumKelley23.3%
 
Watkins50.9%
 
Pridemore17.8%
 
Other8.1%


Walla WallaKelley15.5%
 
Watkins63.6%
 
Pridemore14.0%
 
Other6.9%


WhatcomKelley20.2%
 
Watkins50.2%
 
Pridemore20.9%
 
Other8.7%


WhitmanKelley17.5%
 
Watkins58.7%
 
Pridemore14.5%
 
Other9.4%


YakimaKelley20.4%
 
Watkins62.1%
 
Pridemore6.1%
 
Other11.3%


National DataGraph for 2012 - Washington Results for 2012

Login

Terms of Use - DCMA Policy - Privacy Policy and Cookies


© Dave Leip's Atlas of U.S. Elections, LLC 2019 All Rights Reserved