2012 Senatorial General Election Data Graphs - Wisconsin
Note: The Google advertisement links below may advocate political positions that this site does not endorse.
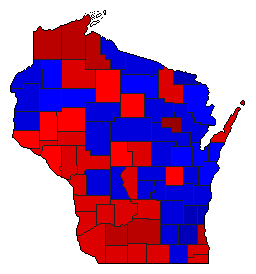
Map

AdamsBaldwin52.6%
 
Thompson44.9%
 
0.0%
 
Other2.5%


AshlandBaldwin63.3%
 
Thompson34.7%
 
0.0%
 
Other2.0%


BarronBaldwin47.8%
 
Thompson48.5%
 
0.0%
 
Other3.8%


BayfieldBaldwin62.5%
 
Thompson36.1%
 
0.0%
 
Other1.4%


BrownBaldwin48.0%
 
Thompson49.1%
 
0.0%
 
Other3.0%


BuffaloBaldwin48.9%
 
Thompson47.8%
 
0.0%
 
Other3.3%


BurnettBaldwin47.4%
 
Thompson50.8%
 
0.0%
 
Other1.8%


CalumetBaldwin42.3%
 
Thompson54.1%
 
0.0%
 
Other3.6%


ChippewaBaldwin48.4%
 
Thompson48.1%
 
0.0%
 
Other3.4%


ClarkBaldwin45.5%
 
Thompson50.7%
 
0.0%
 
Other3.8%


ColumbiaBaldwin53.1%
 
Thompson44.4%
 
0.0%
 
Other2.5%


CrawfordBaldwin56.6%
 
Thompson40.8%
 
0.0%
 
Other2.6%


DaneBaldwin68.8%
 
Thompson29.4%
 
0.0%
 
Other1.8%


DodgeBaldwin40.7%
 
Thompson56.1%
 
0.0%
 
Other3.2%


DoorBaldwin51.4%
 
Thompson45.9%
 
0.0%
 
Other2.7%


DouglasBaldwin65.0%
 
Thompson33.3%
 
0.0%
 
Other1.7%


DunnBaldwin49.6%
 
Thompson46.7%
 
0.0%
 
Other3.7%


Eau ClaireBaldwin54.0%
 
Thompson42.8%
 
0.0%
 
Other3.2%


FlorenceBaldwin35.6%
 
Thompson62.2%
 
0.0%
 
Other2.2%


Fond du LacBaldwin40.7%
 
Thompson56.5%
 
0.0%
 
Other2.8%


ForestBaldwin51.4%
 
Thompson45.5%
 
0.0%
 
Other3.1%


GrantBaldwin50.9%
 
Thompson46.1%
 
0.0%
 
Other3.0%


GreenBaldwin56.0%
 
Thompson41.5%
 
0.0%
 
Other2.5%


Green LakeBaldwin38.2%
 
Thompson58.8%
 
0.0%
 
Other3.1%


IowaBaldwin60.2%
 
Thompson37.4%
 
0.0%
 
Other2.4%


IronBaldwin47.6%
 
Thompson51.3%
 
0.0%
 
Other1.1%


JacksonBaldwin54.4%
 
Thompson42.5%
 
0.0%
 
Other3.1%


JeffersonBaldwin43.9%
 
Thompson53.8%
 
0.0%
 
Other2.4%


JuneauBaldwin47.2%
 
Thompson50.0%
 
0.0%
 
Other2.8%


KenoshaBaldwin54.1%
 
Thompson42.1%
 
0.0%
 
Other3.8%


KewauneeBaldwin47.2%
 
Thompson49.6%
 
0.0%
 
Other3.2%


La CrosseBaldwin54.9%
 
Thompson42.1%
 
0.0%
 
Other3.0%


LafayetteBaldwin52.5%
 
Thompson45.4%
 
0.0%
 
Other2.1%


LangladeBaldwin45.0%
 
Thompson51.6%
 
0.0%
 
Other3.3%


LincolnBaldwin49.4%
 
Thompson46.3%
 
0.0%
 
Other4.3%


ManitowocBaldwin46.9%
 
Thompson49.3%
 
0.0%
 
Other3.8%


MarathonBaldwin46.2%
 
Thompson50.4%
 
0.0%
 
Other3.4%


MarinetteBaldwin47.8%
 
Thompson49.3%
 
0.0%
 
Other2.9%


MarquetteBaldwin46.8%
 
Thompson50.4%
 
0.0%
 
Other2.9%


MenomineeBaldwin79.7%
 
Thompson16.7%
 
0.0%
 
Other3.5%


MilwaukeeBaldwin65.4%
 
Thompson32.5%
 
0.0%
 
Other2.1%


MonroeBaldwin45.0%
 
Thompson51.7%
 
0.0%
 
Other3.3%


OcontoBaldwin45.0%
 
Thompson51.4%
 
0.0%
 
Other3.6%


OneidaBaldwin47.4%
 
Thompson48.0%
 
0.0%
 
Other4.6%


OutagamieBaldwin46.6%
 
Thompson49.7%
 
0.0%
 
Other3.7%


OzaukeeBaldwin33.2%
 
Thompson64.4%
 
0.0%
 
Other2.4%


PepinBaldwin50.4%
 
Thompson47.4%
 
0.0%
 
Other2.2%


PierceBaldwin49.8%
 
Thompson47.8%
 
0.0%
 
Other2.4%


PolkBaldwin46.0%
 
Thompson51.1%
 
0.0%
 
Other2.9%


PortageBaldwin56.1%
 
Thompson41.0%
 
0.0%
 
Other2.9%


PriceBaldwin49.6%
 
Thompson46.9%
 
0.0%
 
Other3.6%


RacineBaldwin50.9%
 
Thompson46.4%
 
0.0%
 
Other2.8%


RichlandBaldwin53.4%
 
Thompson44.9%
 
0.0%
 
Other1.7%


RockBaldwin59.2%
 
Thompson37.9%
 
0.0%
 
Other3.0%


RuskBaldwin46.8%
 
Thompson48.2%
 
0.0%
 
Other5.0%


St. CroixBaldwin44.0%
 
Thompson53.4%
 
0.0%
 
Other2.6%


SaukBaldwin54.6%
 
Thompson42.9%
 
0.0%
 
Other2.5%


SawyerBaldwin50.9%
 
Thompson47.6%
 
0.0%
 
Other1.5%


ShawanoBaldwin44.1%
 
Thompson52.5%
 
0.0%
 
Other3.4%


SheboyganBaldwin42.6%
 
Thompson54.2%
 
0.0%
 
Other3.3%


TaylorBaldwin41.6%
 
Thompson54.4%
 
0.0%
 
Other4.0%


TrempealeauBaldwin54.0%
 
Thompson43.1%
 
0.0%
 
Other2.9%


VernonBaldwin53.8%
 
Thompson43.2%
 
0.0%
 
Other3.1%


VilasBaldwin42.6%
 
Thompson54.0%
 
0.0%
 
Other3.4%


WalworthBaldwin41.6%
 
Thompson54.6%
 
0.0%
 
Other3.7%


WashburnBaldwin48.7%
 
Thompson49.2%
 
0.0%
 
Other2.1%


WashingtonBaldwin29.2%
 
Thompson68.1%
 
0.0%
 
Other2.7%


WaukeshaBaldwin31.4%
 
Thompson66.4%
 
0.0%
 
Other2.2%


WaupacaBaldwin43.2%
 
Thompson53.4%
 
0.0%
 
Other3.4%


WausharaBaldwin44.1%
 
Thompson52.8%
 
0.0%
 
Other3.1%


WinnebagoBaldwin48.9%
 
Thompson47.5%
 
0.0%
 
Other3.7%


WoodBaldwin49.2%
 
Thompson47.3%
 
0.0%
 
Other3.5%


National DataGraph for 2012 - Wisconsin Results for 2012

Login

Terms of Use - DCMA Policy - Privacy Policy and Cookies


© Dave Leip's Atlas of U.S. Elections, LLC 2019 All Rights Reserved