2012 Presidential General Election Data Graphs - Wyoming
by County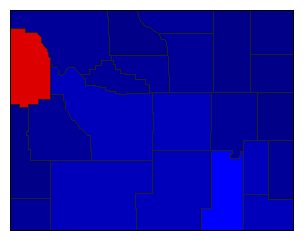
| Albany | Obama | 45.8% | |
| Romney | 48.3% | |
| Other | 6.0% | |
| Big Horn | Obama | 16.3% | |
| Romney | 80.5% | |
| Other | 3.2% | |
| Campbell | Obama | 12.3% | |
| Romney | 85.1% | |
| Other | 2.6% | |
| Carbon | Obama | 32.4% | |
| Romney | 63.7% | |
| Other | 3.9% | |
| Converse | Obama | 17.2% | |
| Romney | 79.5% | |
| Other | 3.3% | |
| Crook | Obama | 11.6% | |
| Romney | 84.4% | |
| Other | 4.1% | |
| Fremont | Obama | 31.5% | |
| Romney | 65.4% | |
| Other | 3.1% | |
| Goshen | Obama | 25.1% | |
| Romney | 72.0% | |
| Other | 2.9% | |
| Hot Springs | Obama | 20.8% | |
| Romney | 75.3% | |
| Other | 3.9% | |
| Johnson | Obama | 17.6% | |
| Romney | 79.0% | |
| Other | 3.5% | |
| Laramie | Obama | 36.2% | |
| Romney | 60.5% | |
| Other | 3.3% | |
| Lincoln | Obama | 14.9% | |
| Romney | 82.9% | |
| Other | 2.2% | |
| Natrona | Obama | 27.7% | |
| Romney | 68.4% | |
| Other | 4.0% | |
| Niobrara | Obama | 15.7% | |
| Romney | 80.1% | |
| Other | 4.2% | |
| Park | Obama | 20.0% | |
| Romney | 76.9% | |
| Other | 3.1% | |
| Platte | Obama | 27.0% | |
| Romney | 69.2% | |
| Other | 3.8% | |
| Sheridan | Obama | 25.3% | |
| Romney | 71.7% | |
| Other | 3.1% | |
| Sublette | Obama | 17.5% | |
| Romney | 79.3% | |
| Other | 3.1% | |
| Sweetwater | Obama | 28.3% | |
| Romney | 67.6% | |
| Other | 4.1% | |
| Teton | Obama | 54.2% | |
| Romney | 42.4% | |
| Other | 3.4% | |
| Uinta | Obama | 19.1% | |
| Romney | 77.5% | |
| Other | 3.5% | |
| Washakie | Obama | 20.1% | |
| Romney | 76.4% | |
| Other | 3.4% | |
| Weston | Obama | 12.6% | |
| Romney | 84.0% | |
| Other | 3.5% | |