2012 Presidential General Election Data Graphs - Colorado
Note: The Google advertisement links below may advocate political positions that this site does not endorse.
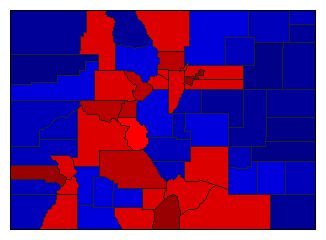
Map

AdamsObama56.9%
 
Romney40.1%
 
Other3.0%


AlamosaObama56.8%
 
Romney40.3%
 
Other3.0%


ArapahoeObama53.9%
 
Romney44.0%
 
Other2.1%


ArchuletaObama39.8%
 
Romney57.5%
 
Other2.7%


BacaObama22.2%
 
Romney74.0%
 
Other3.8%


BentObama42.0%
 
Romney55.4%
 
Other2.7%


BoulderObama69.7%
 
Romney27.8%
 
Other2.5%


BroomfieldObama51.6%
 
Romney45.7%
 
Other2.7%


ChaffeeObama48.6%
 
Romney48.5%
 
Other2.9%


CheyenneObama15.7%
 
Romney81.3%
 
Other2.9%


Clear CreekObama54.3%
 
Romney42.3%
 
Other3.4%


ConejosObama54.0%
 
Romney44.7%
 
Other1.3%


CostillaObama72.9%
 
Romney24.3%
 
Other2.8%


CrowleyObama35.6%
 
Romney61.5%
 
Other2.9%


CusterObama32.0%
 
Romney65.9%
 
Other2.2%


DeltaObama29.0%
 
Romney68.5%
 
Other2.4%


DenverObama73.4%
 
Romney24.2%
 
Other2.4%


DoloresObama26.8%
 
Romney69.0%
 
Other4.2%


DouglasObama36.3%
 
Romney62.1%
 
Other1.5%


EagleObama56.4%
 
Romney41.5%
 
Other2.1%


ElbertObama25.4%
 
Romney72.4%
 
Other2.2%


El PasoObama38.5%
 
Romney58.9%
 
Other2.6%


FremontObama32.8%
 
Romney64.5%
 
Other2.6%


GarfieldObama46.3%
 
Romney51.4%
 
Other2.3%


GilpinObama56.7%
 
Romney40.3%
 
Other3.0%


GrandObama45.0%
 
Romney51.9%
 
Other3.1%


GunnisonObama58.2%
 
Romney38.5%
 
Other3.3%


HinsdaleObama38.2%
 
Romney58.8%
 
Other3.0%


HuerfanoObama52.5%
 
Romney44.2%
 
Other3.3%


JacksonObama25.5%
 
Romney70.8%
 
Other3.8%


JeffersonObama51.2%
 
Romney46.4%
 
Other2.4%


KiowaObama14.4%
 
Romney82.5%
 
Other3.2%


Kit CarsonObama22.6%
 
Romney75.2%
 
Other2.1%


LakeObama60.5%
 
Romney36.1%
 
Other3.4%


La PlataObama52.8%
 
Romney43.7%
 
Other3.5%


LarimerObama51.5%
 
Romney45.7%
 
Other2.8%


Las AnimasObama50.2%
 
Romney47.6%
 
Other2.2%


LincolnObama24.1%
 
Romney73.8%
 
Other2.1%


LoganObama29.7%
 
Romney67.7%
 
Other2.6%


MesaObama32.7%
 
Romney65.1%
 
Other2.2%


MineralObama44.8%
 
Romney52.9%
 
Other2.3%


MoffatObama21.6%
 
Romney76.1%
 
Other2.3%


MontezumaObama36.9%
 
Romney60.1%
 
Other3.0%


MontroseObama30.5%
 
Romney67.3%
 
Other2.2%


MorganObama36.3%
 
Romney61.3%
 
Other2.4%


OteroObama44.5%
 
Romney53.5%
 
Other2.0%


OurayObama51.4%
 
Romney46.3%
 
Other2.3%


ParkObama41.2%
 
Romney55.9%
 
Other2.9%


PhillipsObama26.0%
 
Romney72.3%
 
Other1.8%


PitkinObama68.0%
 
Romney30.0%
 
Other2.0%


ProwersObama31.2%
 
Romney66.4%
 
Other2.3%


PuebloObama55.7%
 
Romney41.7%
 
Other2.6%


Rio BlancoObama16.9%
 
Romney80.9%
 
Other2.3%


Rio GrandeObama44.8%
 
Romney52.7%
 
Other2.5%


RouttObama56.7%
 
Romney41.1%
 
Other2.3%


SaguacheObama63.6%
 
Romney32.9%
 
Other3.5%


San JuanObama52.6%
 
Romney41.9%
 
Other5.5%


San MiguelObama70.3%
 
Romney27.1%
 
Other2.6%


SedgwickObama31.3%
 
Romney65.8%
 
Other2.8%


SummitObama61.0%
 
Romney36.4%
 
Other2.6%


TellerObama32.2%
 
Romney64.6%
 
Other3.3%


WashingtonObama18.1%
 
Romney80.1%
 
Other1.8%


WeldObama42.2%
 
Romney54.8%
 
Other3.0%


YumaObama21.6%
 
Romney76.3%
 
Other2.2%


National DataGraph for 2012 - Colorado Results for 2012

Login

Terms of Use - DCMA Policy - Privacy Policy and Cookies


© Dave Leip's Atlas of U.S. Elections, LLC 2019 All Rights Reserved