2014 Gubernatorial General Election Data Graphs - Massachusetts
by County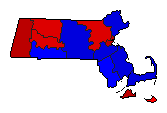
| Barnstable | Coakley | 42.5% | |
| Baker | 53.4% | |
| McCormick | 0.9% | |
| Other | 3.2% | |
| Berkshire | Coakley | 66.2% | |
| Baker | 28.3% | |
| McCormick | 1.0% | |
| Other | 4.5% | |
| Bristol | Coakley | 45.2% | |
| Baker | 49.7% | |
| McCormick | 1.0% | |
| Other | 4.1% | |
| Dukes | Coakley | 61.3% | |
| Baker | 34.1% | |
| McCormick | 1.0% | |
| Other | 3.5% | |
| Essex | Coakley | 43.0% | |
| Baker | 53.0% | |
| McCormick | 0.7% | |
| Other | 3.4% | |
| Franklin | Coakley | 57.3% | |
| Baker | 33.5% | |
| McCormick | 0.9% | |
| Other | 8.2% | |
| Hampden | Coakley | 40.6% | |
| Baker | 48.1% | |
| McCormick | 1.2% | |
| Other | 10.0% | |
| Hampshire | Coakley | 56.4% | |
| Baker | 34.8% | |
| McCormick | 0.8% | |
| Other | 8.0% | |
| Middlesex | Coakley | 50.3% | |
| Baker | 45.4% | |
| McCormick | 0.6% | |
| Other | 3.7% | |
| Nantucket | Coakley | 49.4% | |
| Baker | 46.7% | |
| McCormick | 0.8% | |
| Other | 3.2% | |
| Norfolk | Coakley | 42.9% | |
| Baker | 53.0% | |
| McCormick | 0.6% | |
| Other | 3.5% | |
| Plymouth | Coakley | 38.0% | |
| Baker | 57.2% | |
| McCormick | 0.8% | |
| Other | 4.0% | |
| Suffolk | Coakley | 64.2% | |
| Baker | 31.8% | |
| McCormick | 0.6% | |
| Other | 3.4% | |
| Worcester | Coakley | 38.1% | |
| Baker | 56.6% | |
| McCormick | 0.8% | |
| Other | 4.5% | |