2014 Attorney General General Election Data Graphs - Nevada
Note: The Google advertisement links below may advocate political positions that this site does not endorse.
Data for this Contest was Contributed by on 2014-11-14
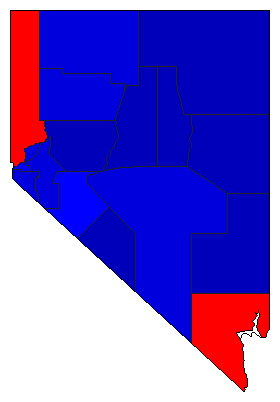
Map

ChurchillMiller24.4%
 
Laxalt62.8%
 
Hansen8.8%
 
Other4.0%


ClarkMiller49.1%
 
Laxalt43.5%
 
Hansen4.8%
 
Other2.7%


DouglasMiller32.0%
 
Laxalt59.2%
 
Hansen6.0%
 
Other2.8%


ElkoMiller21.0%
 
Laxalt65.4%
 
Hansen10.9%
 
Other2.7%


EsmeraldaMiller22.5%
 
Laxalt62.7%
 
Hansen11.7%
 
Other3.1%


EurekaMiller16.0%
 
Laxalt68.3%
 
Hansen10.2%
 
Other5.5%


HumboldtMiller28.7%
 
Laxalt58.5%
 
Hansen8.7%
 
Other4.1%


LanderMiller22.2%
 
Laxalt63.5%
 
Hansen10.7%
 
Other3.6%


LincolnMiller21.6%
 
Laxalt66.2%
 
Hansen8.0%
 
Other4.2%


LyonMiller29.1%
 
Laxalt59.2%
 
Hansen8.6%
 
Other3.1%


MineralMiller35.8%
 
Laxalt48.9%
 
Hansen9.6%
 
Other5.7%


NyeMiller31.3%
 
Laxalt55.1%
 
Hansen9.9%
 
Other3.7%


PershingMiller28.0%
 
Laxalt55.5%
 
Hansen10.9%
 
Other5.5%


StoreyMiller34.9%
 
Laxalt52.0%
 
Hansen9.2%
 
Other3.9%


WashoeMiller46.2%
 
Laxalt44.8%
 
Hansen6.0%
 
Other3.0%


White PineMiller25.6%
 
Laxalt62.4%
 
Hansen8.3%
 
Other3.7%


City

Carson CityMiller43.8%
 
Laxalt47.3%
 
Hansen5.8%
 
Other3.1%


National DataGraph for 2014 - Nevada Results for 2014

Login

Terms of Use - DCMA Policy - Privacy Policy and Cookies


© Dave Leip's Atlas of U.S. Elections, LLC 2019 All Rights Reserved