2014 Senatorial Republican Primary Election Data Graphs - South Carolina
Note: The Google advertisement links below may advocate political positions that this site does not endorse.
Data for this Contest was Contributed by on 2014-07-01
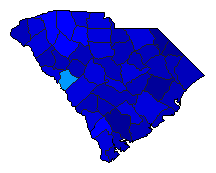
Map

AbbevilleBowers5.1%
 
Graham60.2%
 
Bright12.2%
 
Other22.5%


AikenBowers7.2%
 
Graham51.3%
 
Bright11.1%
 
Other30.4%


AllendaleBowers17.1%
 
Graham56.1%
 
Bright7.3%
 
Other19.5%


AndersonBowers6.4%
 
Graham54.0%
 
Bright12.6%
 
Other27.0%


BambergBowers6.7%
 
Graham69.7%
 
Bright5.6%
 
Other18.0%


BarnwellBowers6.4%
 
Graham67.2%
 
Bright6.7%
 
Other19.7%


BeaufortBowers9.5%
 
Graham61.9%
 
Bright10.6%
 
Other18.0%


BerkeleyBowers5.9%
 
Graham56.3%
 
Bright16.7%
 
Other21.1%


CalhounBowers5.4%
 
Graham59.4%
 
Bright8.6%
 
Other26.6%


CharlestonBowers4.2%
 
Graham63.6%
 
Bright16.5%
 
Other15.7%


CherokeeBowers6.0%
 
Graham54.7%
 
Bright19.7%
 
Other19.6%


ChesterBowers4.0%
 
Graham55.2%
 
Bright18.4%
 
Other22.4%


ChesterfieldBowers6.4%
 
Graham55.8%
 
Bright13.0%
 
Other24.7%


ClarendonBowers11.2%
 
Graham66.3%
 
Bright5.7%
 
Other16.8%


ColletonBowers4.9%
 
Graham73.2%
 
Bright8.4%
 
Other13.6%


DarlingtonBowers11.3%
 
Graham62.6%
 
Bright8.9%
 
Other17.2%


DillonBowers9.6%
 
Graham70.6%
 
Bright7.9%
 
Other11.9%


DorchesterBowers5.8%
 
Graham54.3%
 
Bright19.3%
 
Other20.6%


EdgefieldBowers6.2%
 
Graham38.9%
 
Bright9.3%
 
Other45.6%


FairfieldBowers16.2%
 
Graham56.0%
 
Bright13.7%
 
Other14.2%


FlorenceBowers9.4%
 
Graham60.0%
 
Bright7.9%
 
Other22.7%


GeorgetownBowers14.8%
 
Graham67.9%
 
Bright5.1%
 
Other12.1%


GreenvilleBowers5.9%
 
Graham41.1%
 
Bright26.7%
 
Other26.4%


GreenwoodBowers3.9%
 
Graham63.7%
 
Bright8.4%
 
Other23.9%


HamptonBowers23.6%
 
Graham49.7%
 
Bright9.1%
 
Other17.6%


HorryBowers7.5%
 
Graham67.2%
 
Bright7.9%
 
Other17.4%


JasperBowers16.0%
 
Graham52.6%
 
Bright11.4%
 
Other20.0%


KershawBowers7.8%
 
Graham66.2%
 
Bright7.4%
 
Other18.6%


LancasterBowers5.0%
 
Graham62.6%
 
Bright13.2%
 
Other19.1%


LaurensBowers10.6%
 
Graham47.5%
 
Bright26.6%
 
Other15.3%


LeeBowers10.8%
 
Graham66.6%
 
Bright9.0%
 
Other13.6%


LexingtonBowers10.3%
 
Graham58.0%
 
Bright12.7%
 
Other18.9%


McCormickBowers2.7%
 
Graham52.0%
 
Bright6.8%
 
Other38.6%


MarionBowers8.1%
 
Graham69.5%
 
Bright5.5%
 
Other16.9%


MarlboroBowers7.5%
 
Graham75.8%
 
Bright3.6%
 
Other13.1%


NewberryBowers7.3%
 
Graham64.9%
 
Bright11.0%
 
Other16.8%


OconeeBowers3.4%
 
Graham69.1%
 
Bright6.4%
 
Other21.2%


OrangeburgBowers4.3%
 
Graham65.5%
 
Bright4.0%
 
Other26.1%


PickensBowers4.0%
 
Graham54.5%
 
Bright15.0%
 
Other26.5%


RichlandBowers13.0%
 
Graham63.4%
 
Bright8.6%
 
Other15.0%


SaludaBowers8.6%
 
Graham67.7%
 
Bright6.5%
 
Other17.2%


SpartanburgBowers5.6%
 
Graham43.4%
 
Bright33.4%
 
Other17.6%


SumterBowers22.1%
 
Graham57.2%
 
Bright7.9%
 
Other12.8%


UnionBowers5.4%
 
Graham48.1%
 
Bright29.3%
 
Other17.2%


WilliamsburgBowers4.8%
 
Graham75.9%
 
Bright4.9%
 
Other14.5%


YorkBowers4.3%
 
Graham50.7%
 
Bright19.1%
 
Other25.8%


National DataGraph for 2014 - South Carolina Results for 2014

Login

Terms of Use - DCMA Policy - Privacy Policy and Cookies


© Dave Leip's Atlas of U.S. Elections, LLC 2019 All Rights Reserved