2014 Attorney General General Election Data Graphs - Vermont
by CountyData for this Contest was Contributed by on 2015-01-12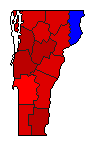
| Addison | Sorrell | 61.8% | |
| McCormack | 34.8% | |
| Other | 3.3% | |
| Bennington | Sorrell | 54.4% | |
| McCormack | 34.9% | |
| Other | 10.7% | |
| Caledonia | Sorrell | 50.6% | |
| McCormack | 45.6% | |
| Other | 3.8% | |
| Chittenden | Sorrell | 63.4% | |
| McCormack | 34.0% | |
| Other | 2.6% | |
| Essex | Sorrell | 45.7% | |
| McCormack | 49.7% | |
| Other | 4.6% | |
| Franklin | Sorrell | 54.5% | |
| McCormack | 42.4% | |
| Other | 3.1% | |
| Grand Isle | Sorrell | 58.8% | |
| McCormack | 38.2% | |
| Other | 3.1% | |
| Lamoille | Sorrell | 57.7% | |
| McCormack | 38.9% | |
| Other | 3.3% | |
| Orange | Sorrell | 56.6% | |
| McCormack | 39.6% | |
| Other | 3.9% | |
| Orleans | Sorrell | 52.8% | |
| McCormack | 42.4% | |
| Other | 4.8% | |
| Rutland | Sorrell | 49.9% | |
| McCormack | 45.7% | |
| Other | 4.4% | |
| Washington | Sorrell | 61.7% | |
| McCormack | 34.2% | |
| Other | 4.1% | |
| Windham | Sorrell | 65.9% | |
| McCormack | 28.0% | |
| Other | 6.1% | |
| Windsor | Sorrell | 59.6% | |
| McCormack | 36.7% | |
| Other | 3.8% | |