2016 Presidential Democratic Primary Election Data Graphs - New Hampshire
by County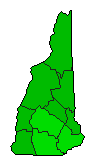
| Belknap | Clinton | 35.5% | |
| 0 | 0.0% | |
| Sanders | 61.0% | |
| Other | 3.5% | |
| Carroll | Clinton | 35.8% | |
| 0 | 0.0% | |
| Sanders | 62.6% | |
| Other | 1.6% | |
| Cheshire | Clinton | 28.8% | |
| 0 | 0.0% | |
| Sanders | 69.8% | |
| Other | 1.5% | |
| Coos | Clinton | 34.5% | |
| 0 | 0.0% | |
| Sanders | 62.3% | |
| Other | 3.2% | |
| Grafton | Clinton | 32.3% | |
| 0 | 0.0% | |
| Sanders | 66.4% | |
| Other | 1.3% | |
| Hillsborough | Clinton | 40.7% | |
| 0 | 0.0% | |
| Sanders | 56.7% | |
| Other | 2.5% | |
| Merrimack | Clinton | 39.5% | |
| 0 | 0.0% | |
| Sanders | 58.3% | |
| Other | 2.2% | |
| Rockingham | Clinton | 41.5% | |
| 0 | 0.0% | |
| Sanders | 56.5% | |
| Other | 1.9% | |
| Strafford | Clinton | 34.9% | |
| 0 | 0.0% | |
| Sanders | 62.9% | |
| Other | 2.2% | |
| Sullivan | Clinton | 28.9% | |
| 0 | 0.0% | |
| Sanders | 68.4% | |
| Other | 2.7% | |