2016 Presidential General Election Data Graphs - Oregon
by County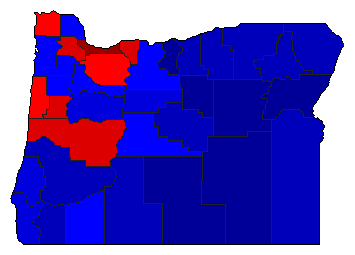
| Baker | Clinton | 20.5% | |
| Trump | 70.8% | |
| McMullin | 0.0% | |
| Other | 8.7% | |
| Benton | Clinton | 59.9% | |
| Trump | 27.6% | |
| McMullin | 0.0% | |
| Other | 12.5% | |
| Clackamas | Clinton | 47.7% | |
| Trump | 41.3% | |
| McMullin | 0.0% | |
| Other | 11.0% | |
| Clatsop | Clinton | 47.1% | |
| Trump | 41.4% | |
| McMullin | 0.0% | |
| Other | 11.6% | |
| Columbia | Clinton | 38.2% | |
| Trump | 49.7% | |
| McMullin | 0.0% | |
| Other | 12.1% | |
| Coos | Clinton | 33.4% | |
| Trump | 57.1% | |
| McMullin | 0.0% | |
| Other | 9.6% | |
| Crook | Clinton | 21.7% | |
| Trump | 69.9% | |
| McMullin | 0.0% | |
| Other | 8.4% | |
| Curry | Clinton | 34.1% | |
| Trump | 57.2% | |
| McMullin | 0.0% | |
| Other | 8.7% | |
| Deschutes | Clinton | 43.1% | |
| Trump | 46.4% | |
| McMullin | 0.0% | |
| Other | 10.6% | |
| Douglas | Clinton | 26.3% | |
| Trump | 64.6% | |
| McMullin | 0.0% | |
| Other | 9.0% | |
| Gilliam | Clinton | 23.5% | |
| Trump | 65.8% | |
| McMullin | 0.0% | |
| Other | 10.7% | |
| Grant | Clinton | 17.0% | |
| Trump | 74.0% | |
| McMullin | 0.0% | |
| Other | 9.0% | |
| Harney | Clinton | 17.2% | |
| Trump | 73.3% | |
| McMullin | 0.0% | |
| Other | 9.5% | |
| Hood River | Clinton | 59.7% | |
| Trump | 30.0% | |
| McMullin | 0.0% | |
| Other | 10.3% | |
| Jackson | Clinton | 40.7% | |
| Trump | 49.3% | |
| McMullin | 0.0% | |
| Other | 10.1% | |
| Jefferson | Clinton | 31.5% | |
| Trump | 58.0% | |
| McMullin | 0.0% | |
| Other | 10.5% | |
| Josephine | Clinton | 30.2% | |
| Trump | 60.4% | |
| McMullin | 0.0% | |
| Other | 9.4% | |
| Klamath | Clinton | 23.6% | |
| Trump | 67.0% | |
| McMullin | 0.0% | |
| Other | 9.4% | |
| Lake | Clinton | 16.3% | |
| Trump | 76.9% | |
| McMullin | 0.0% | |
| Other | 6.8% | |
| Lane | Clinton | 53.5% | |
| Trump | 35.0% | |
| McMullin | 0.0% | |
| Other | 11.5% | |
| Lincoln | Clinton | 49.5% | |
| Trump | 39.7% | |
| McMullin | 0.0% | |
| Other | 10.8% | |
| Linn | Clinton | 30.6% | |
| Trump | 57.0% | |
| McMullin | 0.0% | |
| Other | 12.3% | |
| Malheur | Clinton | 21.5% | |
| Trump | 68.9% | |
| McMullin | 0.0% | |
| Other | 9.5% | |
| Marion | Clinton | 42.2% | |
| Trump | 46.3% | |
| McMullin | 0.0% | |
| Other | 11.5% | |
| Morrow | Clinton | 24.4% | |
| Trump | 65.3% | |
| McMullin | 0.0% | |
| Other | 10.3% | |
| Multnomah | Clinton | 73.3% | |
| Trump | 17.0% | |
| McMullin | 0.0% | |
| Other | 9.7% | |
| Polk | Clinton | 40.7% | |
| Trump | 47.0% | |
| McMullin | 0.0% | |
| Other | 12.2% | |
| Sherman | Clinton | 19.9% | |
| Trump | 72.0% | |
| McMullin | 0.0% | |
| Other | 8.2% | |
| Tillamook | Clinton | 41.8% | |
| Trump | 47.4% | |
| McMullin | 0.0% | |
| Other | 10.8% | |
| Umatilla | Clinton | 27.8% | |
| Trump | 61.8% | |
| McMullin | 0.0% | |
| Other | 10.4% | |
| Union | Clinton | 25.1% | |
| Trump | 65.0% | |
| McMullin | 0.0% | |
| Other | 9.9% | |
| Wallowa | Clinton | 25.6% | |
| Trump | 65.2% | |
| McMullin | 0.0% | |
| Other | 9.2% | |
| Wasco | Clinton | 40.0% | |
| Trump | 48.8% | |
| McMullin | 0.0% | |
| Other | 11.3% | |
| Washington | Clinton | 56.9% | |
| Trump | 30.9% | |
| McMullin | 0.0% | |
| Other | 12.2% | |
| Wheeler | Clinton | 18.9% | |
| Trump | 72.2% | |
| McMullin | 0.0% | |
| Other | 8.8% | |
| Yamhill | Clinton | 39.6% | |
| Trump | 47.7% | |
| McMullin | 0.0% | |
| Other | 12.7% | |