2018 Attorney General General Election Data Graphs - Massachusetts
by CountyData for this Contest was Contributed by on 2019-03-15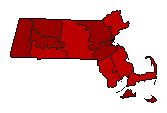
| Barnstable | Healey | 61.3% | |
| McMahon | 38.6% | |
| Other | 0.0% | |
| Berkshire | Healey | 74.9% | |
| McMahon | 24.9% | |
| Other | 0.3% | |
| Bristol | Healey | 61.5% | |
| McMahon | 38.5% | |
| Other | 0.1% | |
| Dukes | Healey | 79.2% | |
| McMahon | 20.8% | |
| Essex | Healey | 68.4% | |
| McMahon | 31.6% | |
| Other | 0.0% | |
| Franklin | Healey | 75.4% | |
| McMahon | 24.6% | |
| Other | 0.0% | |
| Hampden | Healey | 64.1% | |
| McMahon | 35.8% | |
| Other | 0.1% | |
| Hampshire | Healey | 77.1% | |
| McMahon | 22.9% | |
| Other | 0.0% | |
| Middlesex | Healey | 75.3% | |
| McMahon | 24.7% | |
| Other | 0.1% | |
| Nantucket | Healey | 70.7% | |
| McMahon | 29.3% | |
| Other | 0.0% | |
| Norfolk | Healey | 70.8% | |
| McMahon | 29.2% | |
| Other | 0.1% | |
| Plymouth | Healey | 60.9% | |
| McMahon | 39.0% | |
| Other | 0.0% | |
| Suffolk | Healey | 85.0% | |
| McMahon | 14.9% | |
| Other | 0.1% | |
| Worcester | Healey | 61.6% | |
| McMahon | 38.4% | |
| Other | 0.0% | |