2018 State Auditor General Election Data Graphs - Oklahoma
by CountyData for this Contest was Contributed by on 2018-12-10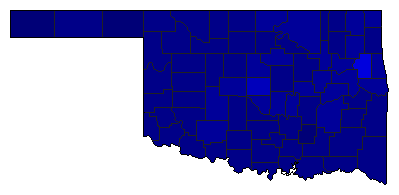
| Adair | | 0.0% | |
| Byrd | 76.6% | |
| Other | 23.4% | |
| Alfalfa | | 0.0% | |
| Byrd | 89.4% | |
| Other | 10.6% | |
| Atoka | | 0.0% | |
| Byrd | 86.6% | |
| Other | 13.4% | |
| Beaver | | 0.0% | |
| Byrd | 91.7% | |
| Other | 8.3% | |
| Beckham | | 0.0% | |
| Byrd | 85.4% | |
| Other | 14.6% | |
| Blaine | | 0.0% | |
| Byrd | 82.9% | |
| Other | 17.1% | |
| Bryan | | 0.0% | |
| Byrd | 82.7% | |
| Other | 17.3% | |
| Caddo | | 0.0% | |
| Byrd | 76.2% | |
| Other | 23.8% | |
| Canadian | | 0.0% | |
| Byrd | 78.9% | |
| Other | 21.1% | |
| Carter | | 0.0% | |
| Byrd | 81.1% | |
| Other | 18.9% | |
| Cherokee | | 0.0% | |
| Byrd | 58.2% | |
| Other | 41.8% | |
| Choctaw | | 0.0% | |
| Byrd | 82.4% | |
| Other | 17.6% | |
| Cimarron | | 0.0% | |
| Byrd | 91.2% | |
| Other | 8.8% | |
| Cleveland | | 0.0% | |
| Byrd | 70.3% | |
| Other | 29.7% | |
| Coal | | 0.0% | |
| Byrd | 91.3% | |
| Other | 8.7% | |
| Comanche | | 0.0% | |
| Byrd | 71.0% | |
| Other | 29.0% | |
| Cotton | | 0.0% | |
| Byrd | 84.0% | |
| Other | 16.0% | |
| Craig | | 0.0% | |
| Byrd | 79.1% | |
| Other | 20.9% | |
| Creek | | 0.0% | |
| Byrd | 80.9% | |
| Other | 19.1% | |
| Custer | | 0.0% | |
| Byrd | 82.5% | |
| Other | 17.5% | |
| Delaware | | 0.0% | |
| Byrd | 81.6% | |
| Other | 18.4% | |
| Dewey | | 0.0% | |
| Byrd | 89.5% | |
| Other | 10.5% | |
| Ellis | | 0.0% | |
| Byrd | 89.2% | |
| Other | 10.8% | |
| Garfield | | 0.0% | |
| Byrd | 82.7% | |
| Other | 17.3% | |
| Garvin | | 0.0% | |
| Byrd | 84.3% | |
| Other | 15.7% | |
| Grady | | 0.0% | |
| Byrd | 82.2% | |
| Other | 17.8% | |
| Grant | | 0.0% | |
| Byrd | 86.3% | |
| Other | 13.7% | |
| Greer | | 0.0% | |
| Byrd | 82.1% | |
| Other | 17.9% | |
| Harmon | | 0.0% | |
| Byrd | 82.9% | |
| Other | 17.1% | |
| Harper | | 0.0% | |
| Byrd | 89.6% | |
| Other | 10.4% | |
| Haskell | | 0.0% | |
| Byrd | 82.3% | |
| Other | 17.7% | |
| Hughes | | 0.0% | |
| Byrd | 81.7% | |
| Other | 18.3% | |
| Jackson | | 0.0% | |
| Byrd | 83.1% | |
| Other | 16.9% | |
| Jefferson | | 0.0% | |
| Byrd | 87.5% | |
| Other | 12.5% | |
| Johnston | | 0.0% | |
| Byrd | 85.1% | |
| Other | 14.9% | |
| Kay | | 0.0% | |
| Byrd | 79.1% | |
| Other | 20.9% | |
| Kingfisher | | 0.0% | |
| Byrd | 88.4% | |
| Other | 11.6% | |
| Kiowa | | 0.0% | |
| Byrd | 81.6% | |
| Other | 18.4% | |
| Latimer | | 0.0% | |
| Byrd | 80.4% | |
| Other | 19.6% | |
| Le Flore | | 0.0% | |
| Byrd | 81.5% | |
| Other | 18.5% | |
| Lincoln | | 0.0% | |
| Byrd | 82.3% | |
| Other | 17.7% | |
| Logan | | 0.0% | |
| Byrd | 79.4% | |
| Other | 20.6% | |
| Love | | 0.0% | |
| Byrd | 83.7% | |
| Other | 16.3% | |
| McClain | | 0.0% | |
| Byrd | 83.5% | |
| Other | 16.5% | |
| McCurtain | | 0.0% | |
| Byrd | 85.6% | |
| Other | 14.4% | |
| McIntosh | | 0.0% | |
| Byrd | 76.3% | |
| Other | 23.7% | |
| Major | | 0.0% | |
| Byrd | 89.5% | |
| Other | 10.5% | |
| Marshall | | 0.0% | |
| Byrd | 84.6% | |
| Other | 15.4% | |
| Mayes | | 0.0% | |
| Byrd | 78.6% | |
| Other | 21.4% | |
| Murray | | 0.0% | |
| Byrd | 82.7% | |
| Other | 17.3% | |
| Muskogee | | 0.0% | |
| Byrd | 71.8% | |
| Other | 28.2% | |
| Noble | | 0.0% | |
| Byrd | 82.8% | |
| Other | 17.2% | |
| Nowata | | 0.0% | |
| Byrd | 80.3% | |
| Other | 19.7% | |
| Okfuskee | | 0.0% | |
| Byrd | 77.8% | |
| Other | 22.2% | |
| Oklahoma | | 0.0% | |
| Byrd | 67.0% | |
| Other | 33.0% | |
| Okmulgee | | 0.0% | |
| Byrd | 71.6% | |
| Other | 28.4% | |
| Osage | | 0.0% | |
| Byrd | 74.8% | |
| Other | 25.2% | |
| Ottawa | | 0.0% | |
| Byrd | 77.4% | |
| Other | 22.6% | |
| Pawnee | | 0.0% | |
| Byrd | 80.0% | |
| Other | 20.0% | |
| Payne | | 0.0% | |
| Byrd | 72.8% | |
| Other | 27.2% | |
| Pittsburg | | 0.0% | |
| Byrd | 78.7% | |
| Other | 21.3% | |
| Pontotoc | | 0.0% | |
| Byrd | 81.7% | |
| Other | 18.3% | |
| Pottawatomie | | 0.0% | |
| Byrd | 78.4% | |
| Other | 21.6% | |
| Pushmataha | | 0.0% | |
| Byrd | 84.4% | |
| Other | 15.6% | |
| Roger Mills | | 0.0% | |
| Byrd | 87.7% | |
| Other | 12.3% | |
| Rogers | | 0.0% | |
| Byrd | 81.2% | |
| Other | 18.8% | |
| Seminole | | 0.0% | |
| Byrd | 77.4% | |
| Other | 22.6% | |
| Sequoyah | | 0.0% | |
| Byrd | 79.9% | |
| Other | 20.1% | |
| Stephens | | 0.0% | |
| Byrd | 84.3% | |
| Other | 15.7% | |
| Texas | | 0.0% | |
| Byrd | 87.5% | |
| Other | 12.5% | |
| Tillman | | 0.0% | |
| Byrd | 81.4% | |
| Other | 18.6% | |
| Tulsa | | 0.0% | |
| Byrd | 71.8% | |
| Other | 28.2% | |
| Wagoner | | 0.0% | |
| Byrd | 79.2% | |
| Other | 20.8% | |
| Washington | | 0.0% | |
| Byrd | 80.5% | |
| Other | 19.5% | |
| Washita | | 0.0% | |
| Byrd | 85.6% | |
| Other | 14.4% | |
| Woods | | 0.0% | |
| Byrd | 86.1% | |
| Other | 13.9% | |
| Woodward | | 0.0% | |
| Byrd | 87.7% | |
| Other | 12.3% | |