2018 Gubernatorial General Election Data Graphs - Wyoming
Note: The Google advertisement links below may advocate political positions that this site does not endorse.
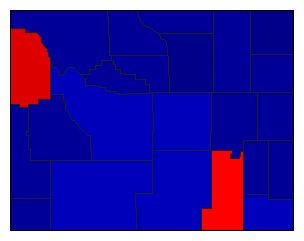
Map

AlbanyThrone49.5%
 
Gordon45.1%
 
0.0%
 
Other5.4%


Big HornThrone14.1%
 
Gordon78.6%
 
0.0%
 
Other7.3%


CampbellThrone14.3%
 
Gordon79.9%
 
0.0%
 
Other5.8%


CarbonThrone25.4%
 
Gordon68.9%
 
0.0%
 
Other5.7%


ConverseThrone15.3%
 
Gordon78.4%
 
0.0%
 
Other6.3%


CrookThrone11.6%
 
Gordon83.4%
 
0.0%
 
Other5.0%


FremontThrone29.9%
 
Gordon64.4%
 
0.0%
 
Other5.6%


GoshenThrone19.9%
 
Gordon74.3%
 
0.0%
 
Other5.8%


Hot SpringsThrone19.7%
 
Gordon74.7%
 
0.0%
 
Other5.6%


JohnsonThrone12.3%
 
Gordon83.6%
 
0.0%
 
Other4.1%


LaramieThrone34.2%
 
Gordon61.3%
 
0.0%
 
Other4.4%


LincolnThrone16.1%
 
Gordon76.8%
 
0.0%
 
Other7.1%


NatronaThrone25.9%
 
Gordon68.9%
 
0.0%
 
Other5.2%


NiobraraThrone13.2%
 
Gordon79.1%
 
0.0%
 
Other7.7%


ParkThrone19.3%
 
Gordon74.6%
 
0.0%
 
Other6.1%


PlatteThrone22.4%
 
Gordon70.0%
 
0.0%
 
Other7.6%


SheridanThrone22.6%
 
Gordon73.9%
 
0.0%
 
Other3.6%


SubletteThrone17.7%
 
Gordon78.3%
 
0.0%
 
Other4.0%


SweetwaterThrone29.1%
 
Gordon64.8%
 
0.0%
 
Other6.2%


TetonThrone56.0%
 
Gordon40.5%
 
0.0%
 
Other3.5%


UintaThrone20.7%
 
Gordon72.6%
 
0.0%
 
Other6.7%


WashakieThrone18.3%
 
Gordon77.0%
 
0.0%
 
Other4.8%


WestonThrone12.9%
 
Gordon78.6%
 
0.0%
 
Other8.5%


National DataGraph for 2018 - Wyoming Results for 2018

Login

Terms of Use - DCMA Policy - Privacy Policy and Cookies


© Dave Leip's Atlas of U.S. Elections, LLC 2019 All Rights Reserved