2018 Gubernatorial General Election Data Graphs - Colorado
by County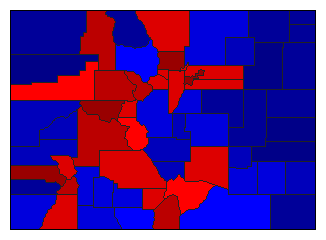
| Adams | Polis | 54.6% | |
| Stapleton | 40.6% | |
| 0.0% | |
| Other | 4.9% | |
| Alamosa | Polis | 50.3% | |
| Stapleton | 44.6% | |
| 0.0% | |
| Other | 5.0% | |
| Arapahoe | Polis | 57.2% | |
| Stapleton | 39.4% | |
| 0.0% | |
| Other | 3.4% | |
| Archuleta | Polis | 41.3% | |
| Stapleton | 55.1% | |
| 0.0% | |
| Other | 3.5% | |
| Baca | Polis | 17.7% | |
| Stapleton | 77.6% | |
| 0.0% | |
| Other | 4.7% | |
| Bent | Polis | 34.1% | |
| Stapleton | 58.5% | |
| 0.0% | |
| Other | 7.4% | |
| Boulder | Polis | 75.5% | |
| Stapleton | 21.8% | |
| 0.0% | |
| Other | 2.7% | |
| Broomfield | Polis | 59.2% | |
| Stapleton | 37.6% | |
| 0.0% | |
| Other | 3.2% | |
| Chaffee | Polis | 49.9% | |
| Stapleton | 45.9% | |
| 0.0% | |
| Other | 4.2% | |
| Cheyenne | Polis | 14.1% | |
| Stapleton | 82.6% | |
| 0.0% | |
| Other | 3.4% | |
| Clear Creek | Polis | 54.5% | |
| Stapleton | 41.2% | |
| 0.0% | |
| Other | 4.3% | |
| Conejos | Polis | 46.7% | |
| Stapleton | 49.6% | |
| 0.0% | |
| Other | 3.8% | |
| Costilla | Polis | 62.9% | |
| Stapleton | 31.7% | |
| 0.0% | |
| Other | 5.4% | |
| Crowley | Polis | 28.8% | |
| Stapleton | 64.0% | |
| 0.0% | |
| Other | 7.2% | |
| Custer | Polis | 31.3% | |
| Stapleton | 65.3% | |
| 0.0% | |
| Other | 3.5% | |
| Delta | Polis | 31.8% | |
| Stapleton | 64.1% | |
| 0.0% | |
| Other | 4.0% | |
| Denver | Polis | 77.4% | |
| Stapleton | 19.5% | |
| 0.0% | |
| Other | 3.1% | |
| Dolores | Polis | 22.8% | |
| Stapleton | 73.3% | |
| 0.0% | |
| Other | 3.9% | |
| Douglas | Polis | 40.5% | |
| Stapleton | 56.1% | |
| 0.0% | |
| Other | 3.4% | |
| Eagle | Polis | 61.8% | |
| Stapleton | 35.0% | |
| 0.0% | |
| Other | 3.2% | |
| Elbert | Polis | 22.2% | |
| Stapleton | 74.3% | |
| 0.0% | |
| Other | 3.5% | |
| El Paso | Polis | 39.5% | |
| Stapleton | 56.1% | |
| 0.0% | |
| Other | 4.4% | |
| Fremont | Polis | 30.8% | |
| Stapleton | 64.2% | |
| 0.0% | |
| Other | 5.0% | |
| Garfield | Polis | 49.0% | |
| Stapleton | 47.5% | |
| 0.0% | |
| Other | 3.5% | |
| Gilpin | Polis | 53.7% | |
| Stapleton | 41.8% | |
| 0.0% | |
| Other | 4.5% | |
| Grand | Polis | 46.4% | |
| Stapleton | 49.5% | |
| 0.0% | |
| Other | 4.0% | |
| Gunnison | Polis | 62.9% | |
| Stapleton | 33.3% | |
| 0.0% | |
| Other | 3.8% | |
| Hinsdale | Polis | 39.2% | |
| Stapleton | 57.2% | |
| 0.0% | |
| Other | 3.6% | |
| Huerfano | Polis | 49.8% | |
| Stapleton | 45.6% | |
| 0.0% | |
| Other | 4.6% | |
| Jackson | Polis | 22.6% | |
| Stapleton | 72.5% | |
| 0.0% | |
| Other | 4.9% | |
| Jefferson | Polis | 54.4% | |
| Stapleton | 41.5% | |
| 0.0% | |
| Other | 4.1% | |
| Kiowa | Polis | 12.3% | |
| Stapleton | 83.2% | |
| 0.0% | |
| Other | 4.6% | |
| Kit Carson | Polis | 17.7% | |
| Stapleton | 78.2% | |
| 0.0% | |
| Other | 4.0% | |
| Lake | Polis | 58.5% | |
| Stapleton | 34.8% | |
| 0.0% | |
| Other | 6.8% | |
| La Plata | Polis | 55.9% | |
| Stapleton | 41.3% | |
| 0.0% | |
| Other | 2.8% | |
| Larimer | Polis | 54.8% | |
| Stapleton | 41.8% | |
| 0.0% | |
| Other | 3.5% | |
| Las Animas | Polis | 47.3% | |
| Stapleton | 48.2% | |
| 0.0% | |
| Other | 4.5% | |
| Lincoln | Polis | 17.3% | |
| Stapleton | 78.1% | |
| 0.0% | |
| Other | 4.7% | |
| Logan | Polis | 21.7% | |
| Stapleton | 73.9% | |
| 0.0% | |
| Other | 4.3% | |
| Mesa | Polis | 35.3% | |
| Stapleton | 61.0% | |
| 0.0% | |
| Other | 3.7% | |
| Mineral | Polis | 43.0% | |
| Stapleton | 53.0% | |
| 0.0% | |
| Other | 4.0% | |
| Moffat | Polis | 17.6% | |
| Stapleton | 78.6% | |
| 0.0% | |
| Other | 3.8% | |
| Montezuma | Polis | 37.6% | |
| Stapleton | 59.2% | |
| 0.0% | |
| Other | 3.2% | |
| Montrose | Polis | 30.9% | |
| Stapleton | 65.8% | |
| 0.0% | |
| Other | 3.3% | |
| Morgan | Polis | 26.7% | |
| Stapleton | 68.9% | |
| 0.0% | |
| Other | 4.3% | |
| Otero | Polis | 39.2% | |
| Stapleton | 54.8% | |
| 0.0% | |
| Other | 6.0% | |
| Ouray | Polis | 58.5% | |
| Stapleton | 38.8% | |
| 0.0% | |
| Other | 2.7% | |
| Park | Polis | 38.3% | |
| Stapleton | 57.3% | |
| 0.0% | |
| Other | 4.5% | |
| Phillips | Polis | 19.3% | |
| Stapleton | 77.0% | |
| 0.0% | |
| Other | 3.7% | |
| Pitkin | Polis | 73.7% | |
| Stapleton | 23.9% | |
| 0.0% | |
| Other | 2.4% | |
| Prowers | Polis | 26.3% | |
| Stapleton | 69.8% | |
| 0.0% | |
| Other | 3.9% | |
| Pueblo | Polis | 50.7% | |
| Stapleton | 44.5% | |
| 0.0% | |
| Other | 4.9% | |
| Rio Blanco | Polis | 16.0% | |
| Stapleton | 81.0% | |
| 0.0% | |
| Other | 3.0% | |
| Rio Grande | Polis | 38.8% | |
| Stapleton | 56.7% | |
| 0.0% | |
| Other | 4.5% | |
| Routt | Polis | 61.1% | |
| Stapleton | 35.8% | |
| 0.0% | |
| Other | 3.0% | |
| Saguache | Polis | 57.3% | |
| Stapleton | 38.0% | |
| 0.0% | |
| Other | 4.8% | |
| San Juan | Polis | 60.2% | |
| Stapleton | 37.1% | |
| 0.0% | |
| Other | 2.7% | |
| San Miguel | Polis | 74.6% | |
| Stapleton | 22.6% | |
| 0.0% | |
| Other | 2.8% | |
| Sedgwick | Polis | 24.0% | |
| Stapleton | 71.1% | |
| 0.0% | |
| Other | 5.0% | |
| Summit | Polis | 66.8% | |
| Stapleton | 29.8% | |
| 0.0% | |
| Other | 3.4% | |
| Teller | Polis | 31.0% | |
| Stapleton | 65.3% | |
| 0.0% | |
| Other | 3.7% | |
| Washington | Polis | 12.3% | |
| Stapleton | 83.9% | |
| 0.0% | |
| Other | 3.8% | |
| Weld | Polis | 37.2% | |
| Stapleton | 58.1% | |
| 0.0% | |
| Other | 4.7% | |
| Yuma | Polis | 17.0% | |
| Stapleton | 79.6% | |
| 0.0% | |
| Other | 3.4% | |