2022 Senatorial General Election Data Graphs - Pennsylvania
Note: The Google advertisement links below may advocate political positions that this site does not endorse.
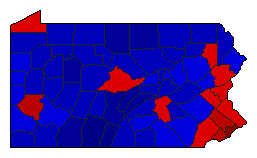
Map

AdamsFetterman34.6%
 
Oz62.4%
 
0.0%
 
Other3.0%


AlleghenyFetterman63.3%
 
Oz34.9%
 
0.0%
 
Other1.8%


ArmstrongFetterman28.3%
 
Oz68.8%
 
0.0%
 
Other2.9%


BeaverFetterman44.4%
 
Oz52.7%
 
0.0%
 
Other2.9%


BedfordFetterman17.0%
 
Oz80.6%
 
0.0%
 
Other2.3%


BerksFetterman46.0%
 
Oz50.3%
 
0.0%
 
Other3.7%


BlairFetterman29.3%
 
Oz68.0%
 
0.0%
 
Other2.7%


BradfordFetterman28.2%
 
Oz68.1%
 
0.0%
 
Other3.7%


BucksFetterman52.3%
 
Oz44.9%
 
0.0%
 
Other2.8%


ButlerFetterman36.3%
 
Oz61.1%
 
0.0%
 
Other2.6%


CambriaFetterman33.4%
 
Oz63.5%
 
0.0%
 
Other3.1%


CameronFetterman29.0%
 
Oz66.0%
 
0.0%
 
Other5.0%


CarbonFetterman36.9%
 
Oz59.6%
 
0.0%
 
Other3.5%


CentreFetterman52.4%
 
Oz44.9%
 
0.0%
 
Other2.7%


ChesterFetterman57.1%
 
Oz40.3%
 
0.0%
 
Other2.6%


ClarionFetterman28.1%
 
Oz68.9%
 
0.0%
 
Other3.0%


ClearfieldFetterman27.1%
 
Oz69.7%
 
0.0%
 
Other3.2%


ClintonFetterman33.8%
 
Oz62.6%
 
0.0%
 
Other3.6%


ColumbiaFetterman36.4%
 
Oz59.8%
 
0.0%
 
Other3.9%


CrawfordFetterman33.5%
 
Oz63.4%
 
0.0%
 
Other3.1%


CumberlandFetterman45.9%
 
Oz51.4%
 
0.0%
 
Other2.8%


DauphinFetterman53.7%
 
Oz43.7%
 
0.0%
 
Other2.5%


DelawareFetterman62.7%
 
Oz34.8%
 
0.0%
 
Other2.5%


ElkFetterman29.8%
 
Oz66.9%
 
0.0%
 
Other3.3%


ErieFetterman53.3%
 
Oz43.9%
 
0.0%
 
Other2.8%


FayetteFetterman37.8%
 
Oz60.2%
 
0.0%
 
Other2.0%


ForestFetterman31.7%
 
Oz65.5%
 
0.0%
 
Other2.8%


FranklinFetterman28.6%
 
Oz68.6%
 
0.0%
 
Other2.8%


FultonFetterman15.2%
 
Oz82.6%
 
0.0%
 
Other2.2%


GreeneFetterman33.5%
 
Oz63.6%
 
0.0%
 
Other3.0%


HuntingdonFetterman25.5%
 
Oz71.2%
 
0.0%
 
Other3.3%


IndianaFetterman34.2%
 
Oz63.3%
 
0.0%
 
Other2.5%


JeffersonFetterman23.2%
 
Oz73.8%
 
0.0%
 
Other3.0%


JuniataFetterman21.6%
 
Oz74.4%
 
0.0%
 
Other4.0%


LackawannaFetterman56.7%
 
Oz41.0%
 
0.0%
 
Other2.3%


LancasterFetterman42.1%
 
Oz55.5%
 
0.0%
 
Other2.4%


LawrenceFetterman37.9%
 
Oz59.4%
 
0.0%
 
Other2.7%


LebanonFetterman34.8%
 
Oz61.9%
 
0.0%
 
Other3.3%


LehighFetterman53.6%
 
Oz43.4%
 
0.0%
 
Other3.0%


LuzerneFetterman44.2%
 
Oz53.2%
 
0.0%
 
Other2.6%


LycomingFetterman29.3%
 
Oz67.3%
 
0.0%
 
Other3.4%


McKeanFetterman28.2%
 
Oz68.7%
 
0.0%
 
Other3.1%


MercerFetterman37.6%
 
Oz59.5%
 
0.0%
 
Other2.9%


MifflinFetterman23.5%
 
Oz72.8%
 
0.0%
 
Other3.6%


MonroeFetterman51.5%
 
Oz45.5%
 
0.0%
 
Other3.0%


MontgomeryFetterman62.9%
 
Oz34.6%
 
0.0%
 
Other2.5%


MontourFetterman40.9%
 
Oz55.1%
 
0.0%
 
Other4.0%


NorthamptonFetterman51.1%
 
Oz46.0%
 
0.0%
 
Other2.9%


NorthumberlandFetterman32.8%
 
Oz63.7%
 
0.0%
 
Other3.5%


PerryFetterman27.8%
 
Oz68.8%
 
0.0%
 
Other3.4%


PhiladelphiaFetterman82.6%
 
Oz15.7%
 
0.0%
 
Other1.7%


PikeFetterman38.9%
 
Oz58.6%
 
0.0%
 
Other2.5%


PotterFetterman19.9%
 
Oz77.1%
 
0.0%
 
Other3.1%


SchuylkillFetterman32.3%
 
Oz63.5%
 
0.0%
 
Other4.1%


SnyderFetterman27.5%
 
Oz69.3%
 
0.0%
 
Other3.2%


SomersetFetterman23.5%
 
Oz73.5%
 
0.0%
 
Other3.0%


SullivanFetterman28.8%
 
Oz67.0%
 
0.0%
 
Other4.2%


SusquehannaFetterman30.2%
 
Oz66.4%
 
0.0%
 
Other3.4%


TiogaFetterman24.6%
 
Oz71.9%
 
0.0%
 
Other3.5%


UnionFetterman38.7%
 
Oz58.3%
 
0.0%
 
Other3.0%


VenangoFetterman32.4%
 
Oz64.1%
 
0.0%
 
Other3.4%


WarrenFetterman33.6%
 
Oz63.1%
 
0.0%
 
Other3.3%


WashingtonFetterman42.2%
 
Oz55.7%
 
0.0%
 
Other2.1%


WayneFetterman33.7%
 
Oz63.4%
 
0.0%
 
Other3.0%


WestmorelandFetterman39.4%
 
Oz58.4%
 
0.0%
 
Other2.2%


WyomingFetterman34.4%
 
Oz62.2%
 
0.0%
 
Other3.4%


YorkFetterman38.5%
 
Oz58.7%
 
0.0%
 
Other2.9%


National DataGraph for 2022 - Pennsylvania Results for 2022

Login

Terms of Use - DCMA Policy - Privacy Policy and Cookies


© Dave Leip's Atlas of U.S. Elections, LLC 2019 All Rights Reserved