Home
2024
Election Results
Election Info
Weblog
Forum
Wiki
Search
Email
Login
Site Info
Store
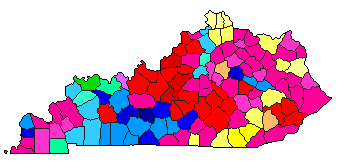
1995 Secretary of State Democratic Primary Election Results - Kentucky
Note: The Google advertisement links below may advocate political positions that this site does not endorse.
Data for this Contest was Contributed by on 2011-06-26
Secretary of State
Candidate
Political
Party
Popular Vote
John Y. Brown III
Democratic
106,064
34.65%
Ed Logsdon
Democratic
56,350
18.41%
Carol Palmore
Democratic
45,157
14.75%
Frances Jones Mills
Democratic
41,457
13.54%
Don Blevins
Democratic
31,674
10.35%
George W. Wilson
Democratic
25,373
8.29%
Map Key
> 20%
> 30%
> 40%
> 50%
> 60%
> 70%
Turnout
Maps
Pop. (m)
Demographic Data
2000 Population:
4,041,769
Enum.
2000 Population Density:
39.3
persons/km
2
1995 Population:
3,887,427
Est.
1995 Population Density:
37.8
persons/km
2
1990 Population:
3,686,892
Enum.
1990 Population Density:
35.8
persons/km
2
Land Area (2000):
102,896
km
2
Annual Pop Growth Rate:
0.9
%
Election Data and Statistics:
County Data (Table)
(m)
County Data (Graphs)
Purchase Detailed Data
Compare State Maps by Year
View All 1995 Kentucky Maps
Election Tools
Atlas Forum
Image Code for Maps:
County
,
Pop
Data Sources:
Source for Popular Vote data: Kentucky State Board of Elections.
PRIMARY ELECTION
, Kentucky State Board of Elections (http://elect.ky.gov/NR/rdonlyres/73E40E44-C464-4B98-AF0B-06630A6B783A/0/95sosrevise.txt) (accessed 14 Feb 2007)
Source for Population data: U.S. Census Bureau.
Results for and Individual County:
(m)
Choose Year
2015
2011
2007
2003
1991
1987
1983
1979
Choose Office
Governor
State Treasurer
State Auditor
Agriculture Commissioner
Choose State
Kentucky Election Results Home
-
National Results for 1995
-
Use Frame Navigation
Login
Terms of Use
-
DCMA Policy
-
Privacy Policy and Cookies
©
Dave Leip's Atlas of U.S. Elections, LLC 2019 All Rights Reserved


