Home
2024
Election Results
Election Info
Weblog
Forum
Wiki
Search
Email
Login
Site Info
Store
1978 Gubernatorial General Election Results - Maryland
Note: The Google advertisement links below may advocate political positions that this site does not endorse.
Data for this Contest was Contributed by on 2012-10-27
Gubernatorial
Candidate
Political
Party
Popular Vote
Harry Hughes
Democratic
718,328
70.98%
John Glenn Beall, Jr
Republican
293,635
29.02%
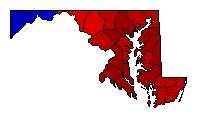
Map Key
> 50%
> 60%
> 70%
> 80%
Turnout
Maps
Pop. (m)
Demographic Data
1980 Population:
4,216,933
Enum.
1980 Population Density:
166.6
persons/km
2
1978 Population:
0
Est.
1978 Population Density:
0.0
persons/km
2
1970 Population:
3,923,897
Enum.
1970 Population Density:
155.0
persons/km
2
Land Area (2000):
25,314
km
2
Annual Pop Growth Rate:
0.7
%
Election Data and Statistics:
County Data (Table)
(m)
County Data (Graphs)
Purchase Detailed Data
Compare State Data by Year (Table)
Compare State Data by Year (Graphs)
View All 1978 Maryland Data
Compare State Maps by Year
View All 1978 Maryland Maps
Election Tools
Atlas Forum
Image Code for Maps:
County
,
Pop
Data Sources:
Source for Popular Vote data: Maryland State Archives.
Maryland Manual, 1979-80, Volume 179, Page 673
, Maryland State Archives (http://www.msa.md.gov/megafile/msa/speccol/sc2900/sc2908/000001/000179/html/am179--673.html) (accessed 27 Oct 2012)
Source for Population data: U.S. Census Bureau.
Results for and Individual County:
(m)
Choose Year
2022
2018
2014
2010
2006
2002
1998
1994
1990
1986
1982
1974
1970
1966
1962
1958
1954
1950
1946
1942
1938
1934
1930
1926
1923
1919
1915
1899
Choose Office
Attorney General
Comptroller General
Choose State
Alabama
Arizona
Arkansas
California
Colorado
Connecticut
Florida
Georgia
Hawaii
Illinois
Iowa
Kansas
Maine
Massachusetts
Michigan
Minnesota
Nebraska
Nevada
New Hampshire
New Mexico
Ohio
Oklahoma
Oregon
Pennsylvania
Rhode Island
South Carolina
South Dakota
Tennessee
Texas
Vermont
Wisconsin
Wyoming
1990 >
Maryland Election Results Home
-
National Results for 1978
-
Use Frame Navigation
Login
Terms of Use
-
DCMA Policy
-
Privacy Policy and Cookies
©
Dave Leip's Atlas of U.S. Elections, LLC 2019 All Rights Reserved


