Home
2024
Election Results
Election Info
Weblog
Forum
Wiki
Search
Email
Login
Site Info
Store
1960 Lt. Gubernatorial General Election Results - Minnesota
Note: The Google advertisement links below may advocate political positions that this site does not endorse.
Data for this Contest was Contributed by on 2016-01-25
Lt. Gubernatorial
Candidate
Political
Party
Popular Vote
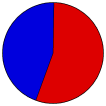
Karl Rolvaag
Democratic-Farmer-Labor
822,923
55.07%
Arthur Ogle
Republican
671,482
44.93%
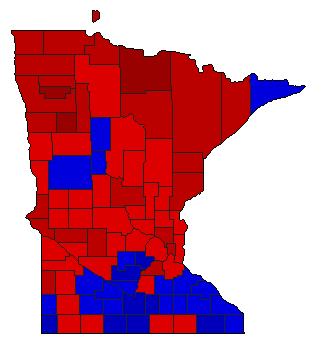
Map Key
> 40%
> 50%
> 60%
> 70%
Turnout
Maps
Pop. (m)
Demographic Data
1960 Population:
3,413,864
Enum.
1960 Population Density:
16.6
persons/km
2
1950 Population:
2,982,483
Enum.
1950 Population Density:
14.5
persons/km
2
Land Area (2000):
206,189
km
2
Annual Pop Growth Rate:
1.4
%
Election Data and Statistics:
County Data (Table)
(m)
County Data (Graphs)
Compare State Data by Year (Table)
Compare State Data by Year (Graphs)
View All 1960 Minnesota Data
Compare State Maps by Year
View All 1960 Minnesota Maps
Election Tools
Atlas Forum
Image Code for Maps:
County
,
Pop
Data Sources:
Source for Popular Vote data: Minnesota Secretary of State.
Minnesota Legislative Manual
, Minnesota Secretary of State (http://www.leg.state.mn.us/archive/sessions/electionresults/1960-11-08-g-man.pdf) (accessed 25 Jan 2016)
Source for Population data: U.S. Census Bureau.
Results for and Individual County:
(m)
Choose Year
1970
1966
1962
1958
1956
1954
1952
1950
1948
1946
1944
1924
1912
Choose Office
President
Senator
Governor
Secretary of State
State Treasurer
Attorney General
Legislative Session; Legislators' Candidacy
Legislative Reapportionment
Succession to Governor and Emergency Government
Voting Residence Change 30 Days Before Election
Choose State
Delaware
Illinois
Kansas
Massachusetts
Michigan
Nebraska
North Dakota
Rhode Island
South Dakota
Washington
Minnesota Election Results Home
-
National Results for 1960
-
Use Frame Navigation
Login
Terms of Use
-
DCMA Policy
-
Privacy Policy and Cookies
©
Dave Leip's Atlas of U.S. Elections, LLC 2019 All Rights Reserved


