Home
2024
Election Results
Election Info
Weblog
Forum
Wiki
Search
Email
Login
Site Info
Store
1956 Attorney General Democratic Primary Election Results - Minnesota
Note: The Google advertisement links below may advocate political positions that this site does not endorse.
Data for this Contest was Contributed by on 2017-05-21
Attorney General
Candidate
Political
Party
Popular Vote
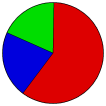
Miles Lord
Democratic-Farmer-Labor
174,868
59.73%
Gordon C. Peterson
Democratic-Farmer-Labor
63,319
21.63%
Frank Patrick Ryan
Democratic-Farmer-Labor
54,600
18.65%
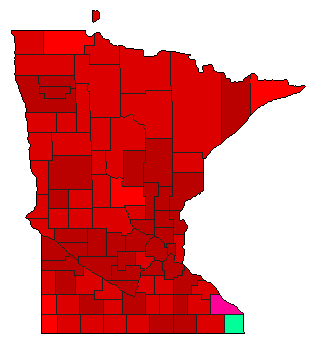
Map Key
> 30%
> 40%
> 50%
> 60%
Turnout
Maps
Demographic Data
1960 Population:
3,413,864
Enum.
1960 Population Density:
16.6
persons/km
2
1950 Population:
2,982,483
Enum.
1950 Population Density:
14.5
persons/km
2
Land Area (2000):
206,189
km
2
Annual Pop Growth Rate:
1.4
%
Election Data and Statistics:
County Data (Table)
(m)
County Data (Graphs)
(m)
Compare State Maps by Year
View All 1956 Minnesota Maps
Election Tools
Atlas Forum
Image Code for Maps:
County
Data Sources:
Source for Popular Vote data: Minnesota Legislative Manual 1957.
Primary Election Returns
, Minnesota Legislative Manual 1957 (https://www.leg.state.mn.us/archive/sessions/electionresults/1956-09-11-p-man.pdf) (accessed 21 May 2017)
Source for Population data: U.S. Census Bureau.
Results for and Individual County:
(m)
Choose Year
2018
2014
2010
2006
2002
1998
1994
1990
1986
1982
1978
1974
1954
1952
1950
1948
1946
Choose Office
Governor
Lt. Governor
Secretary of State
State Treasurer
Choose State
Massachusetts
Oregon
Minnesota Election Results Home
-
National Results for 1956
-
Use Frame Navigation
Login
Terms of Use
-
DCMA Policy
-
Privacy Policy and Cookies
©
Dave Leip's Atlas of U.S. Elections, LLC 2019 All Rights Reserved


