Home
2024
Election Results
Election Info
Weblog
Forum
Wiki
Search
Email
Login
Site Info
Store
1978 Senatorial Special Election Results - Minnesota
Note: The Google advertisement links below may advocate political positions that this site does not endorse.
Data for this Contest was Contributed by on 2016-01-29
Senatorial
Candidate
Political
Party
Popular Vote
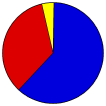
David Durenberger
Independent-Republican
957,908
61.50%
Bob Short
Democratic-Farmer-Labor
538,675
34.59%
Paul Helm
American Party of Minnesota
45,402
2.92%
Christine Frank
Socialist Worker
11,397
0.73%
Fred G. Hewitt
Libertarian
4,116
0.26%
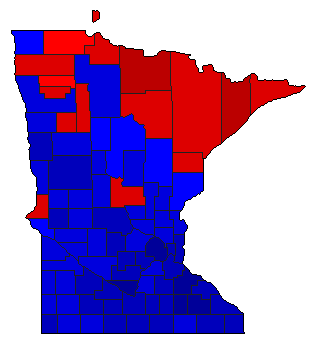
Map Key
> 40%
> 50%
> 60%
> 70%
Turnout
Maps
Pop. (m)
Demographic Data
1980 Population:
4,075,970
Enum.
1980 Population Density:
19.8
persons/km
2
1978 Population:
0
Est.
1978 Population Density:
0.0
persons/km
2
1970 Population:
3,806,103
Enum.
1970 Population Density:
18.5
persons/km
2
Land Area (2000):
206,189
km
2
Annual Pop Growth Rate:
0.7
%
Election Data and Statistics:
County Data (Table)
(m)
County Data (Graphs)
Purchase Detailed Data
Compare State Maps by Year
View All 1978 Minnesota Maps
Election Tools
Atlas Forum
Image Code for Maps:
County
,
Pop
Data Sources:
Source for Popular Vote data: Minnesota Secretary of State.
Minnesota Legislative Manual
, Minnesota Secretary of State (http://www.leg.state.mn.us/archive/sessions/electionresults/1978-11-07-g-sec.pdf) (accessed 27 Jan 2016)
Source for Population data: U.S. Census Bureau.
Results for and Individual County:
(m)
Choose Year
2018
1942
1936
1923
Choose Office
Choose State
Minnesota Election Results Home
-
National Results for 1978
-
Use Frame Navigation
Login
Terms of Use
-
DCMA Policy
-
Privacy Policy and Cookies
©
Dave Leip's Atlas of U.S. Elections, LLC 2019 All Rights Reserved


