Home
2024
Election Results
Election Info
Weblog
Forum
Wiki
Search
Email
Login
Site Info
Store
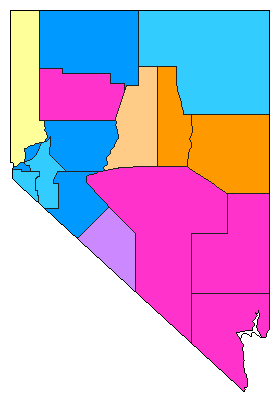
1966 Lt. Gubernatorial Democratic Primary Election Results - Nevada
Note: The Google advertisement links below may advocate political positions that this site does not endorse.
Data for this Contest was Contributed by on 2014-06-22
Lt. Gubernatorial
Candidate
Political
Party
Popular Vote
John P. Foley
Democratic
14,733
21.24%
Harley E. Harmon
Democratic
14,524
20.94%
D. N. (Mike) O'Callaghan
Democratic
14,419
20.79%
Bill Galt
Democratic
12,442
17.94%
William G. (Bill) Flangas
Democratic
6,777
9.77%
Victor F. Whittlesea
Democratic
5,479
7.90%
Herman Hereford
Democratic
990
1.43%
Map Key
> 20%
> 30%
> 40%
> 50%
> 60%
Turnout
Maps
Demographic Data
1970 Population:
488,738
Enum.
1970 Population Density:
1.7
persons/km
2
1960 Population:
285,278
Enum.
1960 Population Density:
1.0
persons/km
2
Land Area (2000):
284,448
km
2
Annual Pop Growth Rate:
5.5
%
Election Data and Statistics:
County Data (Table)
(m)
County Data (Graphs)
Compare State Maps by Year
View All 1966 Nevada Maps
Election Tools
Atlas Forum
Image Code for Maps:
County
Data Sources:
Source for Popular Vote data: NV Secretary of State.
Summary of Primary Election
, NV Secretary of State (http://nvsos.gov/Modules/ShowDocument.aspx?documentid=3130) (accessed 22 Jun 2014)
Source for Population data: U.S. Census Bureau.
Results for and Individual County:
(m)
Choose Year
2010
2006
1978
1974
1970
1962
1926
1914
Choose Office
Governor
Attorney General
Choose State
Minnesota
Nevada Election Results Home
-
National Results for 1966
-
Use Frame Navigation
Login
Terms of Use
-
DCMA Policy
-
Privacy Policy and Cookies
©
Dave Leip's Atlas of U.S. Elections, LLC 2019 All Rights Reserved


