Home
2024
Election Results
Election Info
Weblog
Forum
Wiki
Search
Email
Login
Site Info
Store
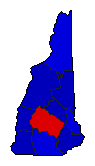
1938 Gubernatorial General Election Results - New Hampshire
Note: The Google advertisement links below may advocate political positions that this site does not endorse.
Data for this Contest was Contributed by on 2013-05-12
Gubernatorial
Candidate
Political
Party
Popular Vote
Francis P. Murphy
Republican
107,841
57.08%
John L. Sullivan
Democratic
80,847
42.79%
Elba K. Chase
Communist
237
0.13%
Map Key
> 40%
> 50%
> 60%
> 70%
Turnout
Maps
Demographic Data
1940 Population:
491,524
Enum.
1940 Population Density:
21.2
persons/km
2
1930 Population:
465,293
Enum.
1930 Population Density:
20.0
persons/km
2
Land Area (2000):
23,227
km
2
Annual Pop Growth Rate:
0.5
%
Election Data and Statistics:
County Data (Table)
(m)
County Data (Graphs)
(m)
Compare State Data by Year (Table)
Compare State Data by Year (Graphs)
View All 1938 New Hampshire Data
Compare State Maps by Year
View All 1938 New Hampshire Maps
Election Tools
Atlas Forum
Image Code for Maps:
County
Data Sources:
Source for Popular Vote data: New Hampshire Secretary of State.
State of New Hampshire Manual for the General Court 1939
, New Hampshire Secretary of State (http://) (accessed 12 May 2013)
Source for Population data: U.S. Census Bureau.
Results for and Individual County:
(m)
Choose Year
2022
2020
2018
2016
2014
2012
2010
2008
2006
2004
2002
2000
1998
1996
1994
1992
1990
1988
1986
1984
1982
1980
1978
1976
1974
1972
1970
1968
1966
1964
1962
1960
1958
1956
1954
1952
1950
1948
1946
1944
1942
1940
1936
1934
1932
1916
1912
Choose Office
Choose State
Arizona
California
Colorado
Connecticut
Iowa
Maryland
Massachusetts
Michigan
Minnesota
Nebraska
Nevada
Oregon
Pennsylvania
Vermont
Wisconsin
1990 >
New Hampshire Election Results Home
-
National Results for 1938
-
Use Frame Navigation
Login
Terms of Use
-
DCMA Policy
-
Privacy Policy and Cookies
©
Dave Leip's Atlas of U.S. Elections, LLC 2019 All Rights Reserved


