Home
2024
Election Results
Election Info
Weblog
Forum
Wiki
Search
Email
Login
Site Info
Store
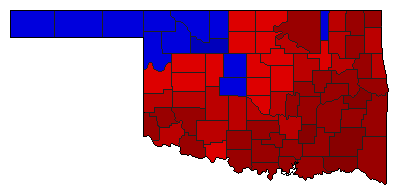
1990 Lt. Gubernatorial General Election Results - Oklahoma
Note: The Google advertisement links below may advocate political positions that this site does not endorse.
Data for this Contest was Contributed by on 2014-07-11
Lt. Gubernatorial
Candidate
Political
Party
Popular Vote
Jack Mildren
Democratic
537,777
60.86%
Terry Neese
Republican
345,831
39.14%
Map Key
> 50%
> 60%
> 70%
> 80%
Turnout
Maps
Pop. (m)
Demographic Data
1990 Population:
3,145,576
Enum.
1990 Population Density:
17.7
persons/km
2
1980 Population:
3,025,487
Enum.
1980 Population Density:
17.0
persons/km
2
Land Area (2000):
177,847
km
2
Annual Pop Growth Rate:
0.4
%
Election Data and Statistics:
County Data (Table)
(m)
County Data (Graphs)
Purchase Detailed Data
Compare State Data by Year (Table)
Compare State Data by Year (Graphs)
View All 1990 Oklahoma Data
Compare State Maps by Year
View All 1990 Oklahoma Maps
Election Tools
Atlas Forum
Image Code for Maps:
County
,
Pop
Data Sources:
Source for Popular Vote data: Oklahoma State Election Board.
Election Results & Statistics 1990
, Oklahoma State Election Board (http://digitalprairie.ok.gov/cdm/compoundobject/collection/stgovpub/id/9947/rec/17) (accessed 11 Jul 2014)
Source for Population data: U.S. Census Bureau.
Results for and Individual County:
(m)
Choose Year
2022
2018
2014
2010
2006
2002
1998
1994
1986
1982
1978
Choose Office
Senator
Governor
State Treasurer
Choose State
Alabama
California
Georgia
Idaho
Nevada
Rhode Island
South Carolina
2022 >
Oklahoma Election Results Home
-
National Results for 1990
-
Use Frame Navigation
Login
Terms of Use
-
DCMA Policy
-
Privacy Policy and Cookies
©
Dave Leip's Atlas of U.S. Elections, LLC 2019 All Rights Reserved


