Home
2024
Election Results
Election Info
Weblog
Forum
Wiki
Search
Email
Login
Site Info
Store
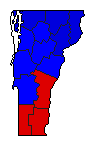
2006 State Auditor General Election Results - Vermont
Note: The Google advertisement links below may advocate political positions that this site does not endorse.
Data for this Contest was Contributed by on 2013-09-18
State Auditor
Candidate
Political
Party
Popular Vote
Tom Salmon
Democratic
111,741
44.54%
Randy Brock
Republican
111,637
44.50%
Martha Abbott
Progressive
23,483
9.36%
Jerry Levy
Liberty Union
3,913
1.56%
Write-ins
-
108
0.04%
Map Key
> 40%
> 50%
> 60%
> 70%
Turnout
Maps
Election Notes:
Above totals reflect the recount vote. The original vote totals had Brock leading by over 130 votes.
Demographic Data
2010 Population:
625,741
Enum.
2010 Population Density:
26.1
persons/km
2
2006 Population:
622,892
Est.
2006 Population Density:
26.0
persons/km
2
2000 Population:
608,827
Enum.
2000 Population Density:
25.4
persons/km
2
Land Area (2000):
23,956
km
2
Annual Pop Growth Rate:
0.3
%
Election Data and Statistics:
County Data (Table)
(m)
County Data (Graphs)
Purchase Detailed Data
Compare State Data by Year (Table)
Compare State Data by Year (Graphs)
View All 2006 Vermont Data
Compare State Maps by Year
View All 2006 Vermont Maps
Election Tools
Atlas Forum
Image Code for Maps:
County
,
Pop
Data Sources:
Source for Popular Vote data: Vermont Secretary of State.
Vermont Secretary of State
, Vermont Secretary of State (http://vermont-elections.org/elections1/2006RecountAuditorResults12.19.06.pdf) (accessed 18 Sep 2013)
Source for Population data: U.S. Census Bureau.
Results for and Individual County:
Addison County
Bennington County
Caledonia County
Chittenden County
Essex County
Franklin County
Grand Isle County
Lamoille County
Orange County
Orleans County
Rutland County
Washington County
Windham County
Windsor County
Choose Year
2022
2016
2014
2012
2010
2008
2004
2002
2000
1974
Choose Office
Senator
Governor
Lt. Governor
Secretary of State
State Treasurer
Attorney General
Choose State
Alabama
Arkansas
Delaware
Indiana
Iowa
Massachusetts
Minnesota
Missouri
Nebraska
New Mexico
Ohio
Oklahoma
Wyoming
2022 >
Vermont Election Results Home
-
National Results for 2006
-
Use Frame Navigation
Login
Terms of Use
-
DCMA Policy
-
Privacy Policy and Cookies
©
Dave Leip's Atlas of U.S. Elections, LLC 2019 All Rights Reserved


