| |
Presidential
Candidate | Vice Presidential
Candidate | Political
Party | Popular Vote | Electoral Vote |
 | Ronald Reagan | George Bush | Republican |
635,274 |
49.07% | 9 |
 | James Carter | Walter Mondale | Democrat |
616,417 |
47.61% | 0 |
 | John Anderson | Patrick Lucey | And. Coalition |
31,127 |
2.40% | 0 |
| Edward Clark | David Koch | Libertarian |
5,531 |
0.43% | 0 |
| Ellen McCormack | Carroll Driscoll | Respect for Life |
4,233 |
0.33% | 0 |
| Other (+) | - | - |
2,045 |
0.16% | 0 |
 |
Map Key
| > 40% |
 |
 |
| > 50% |
 |
 |
| > 60% |
 |
 |
| > 70% |
 |
 |
| > 80% |
 |
 |
| Turnout
 |  |  |
|
| Maps | 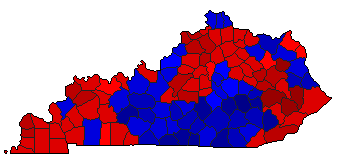 |  | | Pop. (m) | | Rep. (m) | | Dem. (m) | | Swg (m) | | Tnd (m) |
| |
| Demographic Data
| 1980 Population: | 3,660,324 | Enum. | 1980 Population Density: | 35.6 | persons/km2 | | 1970 Population: | 3,220,711 | Enum. | 1970 Population Density: | 31.3 | persons/km2 | | Total Electoral Vote: | 9 | | Electoral Vote Density: | 406,703 | persons/EV | | Land Area (2000): | 102,896 | km2 | Annual Pop Growth Rate: | 1.3 | % |
| Election Data and Statistics:
| Election Tools
- Atlas Forum Image Code for Maps: County, Pop, Tnd, Swg
Data Sources:
- Source for Popular Vote data: Kentucky Secretary of State, Official Primary and General Election Returns for 1980 (Frankfurt, 0)
- Source for Population data: U.S. Census Bureau.
| Results for and Individual County:
|
|
| |


