| |
Presidential
Candidate | Vice Presidential
Candidate | Political
Party | Popular Vote | Electoral Vote |
 | Gerald Ford | Robert Dole | Republican |
545,708 |
49.96% | 8 |
 | James Carter | Walter Mondale | Democrat |
532,442 |
48.75% | 0 |
 | Eugene McCarthy | - | Independent |
14,101 |
1.29% | 0 |
 |
Map Key
| Turnout
 |  |  |
|
| Maps | 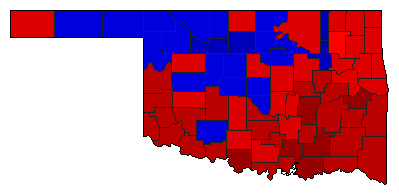 |  | | Pop. (m) | | Rep. (m) | | Dem. (m) | | Swg (m) | | Tnd (m) |
| |
| Demographic Data
| 1980 Population: | 3,025,487 | Enum. | 1980 Population Density: | 17.0 | persons/km2 | | 1976 Population: | 2,823,396 | Est. | 1976 Population Density: | 15.9 | persons/km2 | | 1970 Population: | 2,559,463 | Enum. | 1970 Population Density: | 14.4 | persons/km2 | | Total Electoral Vote: | 8 | | Electoral Vote Density: | 352,925 | persons/EV | | Land Area (2000): | 177,847 | km2 | Annual Pop Growth Rate: | 1.7 | % |
| Presidential Electors:
- Method of Choosing:Popular Vote - Winner-Take-All
- Table of Presidential Electors for Oklahoma in 1976 (m)
| Election Data and Statistics:
| Election Tools
- Atlas Forum Image Code for Maps: County, Pop, Tnd, Swg
Data Sources:
- Source for Popular Vote data: Oklahoma State Election Board, Official Returns General Election, November 2, 1976 Presidential Electors (Oklahoma City, 1976)
- Source for Population data: U.S. Census Bureau.
| Results for and Individual County:
|
|
| |


