| |
Presidential
Candidate | Vice Presidential
Candidate | Political
Party | Popular Vote | Electoral Vote |
 | George Bush | J. Danforth Quayle | Republican |
678,367 |
57.93% | 8 |
 | Michael Dukakis | Lloyd Bentsen | Democrat |
483,423 |
41.28% | 0 |
 | Ron Paul | Andre Marrou | Libertarian |
6,261 |
0.53% | 0 |
| Lenora Fulani | Joyce Dattner | New Alliance |
2,985 |
0.25% | 0 |
 |
Map Key
| Turnout
 |  |  |
|
| Maps | 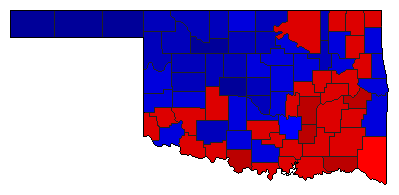 |  |  | | Pop. (m) | | Rep. (m) | | Dem. (m) | | Swg (m) | | Tnd (m) |
| |
| Demographic Data
| 1990 Population: | 3,145,576 | Enum. | 1990 Population Density: | 17.7 | persons/km2 | | 1988 Population: | 3,167,148 | Est. | 1988 Population Density: | 17.8 | persons/km2 | | 1980 Population: | 3,025,487 | Enum. | 1980 Population Density: | 17.0 | persons/km2 | | Total Electoral Vote: | 8 | | Electoral Vote Density: | 395,894 | persons/EV | | Land Area (2000): | 177,847 | km2 | Annual Pop Growth Rate: | 0.4 | % |
| Presidential Electors:
- Method of Choosing:Popular Vote - Winner-Take-All
- Table of Presidential Electors for Oklahoma in 1988 (m)
| Election Data and Statistics:
| Election Tools
- Atlas Forum Image Code for Maps: County, Pop, Tnd, Swg
Data Sources:
- Source for Popular Vote data: Oklahoma State Election Board, Official Returns General Election, November 8, 1988 Presidential Electors (Oklahoma City, 0)
- Source for Population data: U.S. Census Bureau.
| Results for and Individual County:
|
|
| |


