| |
Presidential
Candidate | Vice Presidential
Candidate | Political
Party | Popular Vote | Electoral Vote |
 | Lyndon Johnson | Hubert Humphrey | Democratic |
43,129,040 |
61.05% | 43,129,040 |
 | Barry Goldwater | William Miller | Republican |
27,175,754 |
38.47% | 27,175,754 |
 | Unpledged Elector | - | - |
210,732 |
0.30% | 210,732 |
| Eric Hass | Henning Blomen | Socialist Labor |
45,189 |
0.06% | 45,189 |
| Clifton DeBerry | Edward Shaw | Socialist Workers |
32,706 |
0.05% | 32,706 |
| E. Harold Munn | Mark Shaw | Prohibition |
23,267 |
0.03% | 23,267 |
| Write-in | - | - |
12,818 |
0.02% | 12,818 |
| John Kasper | Jesse Stoner | National State's Rights |
6,953 |
0.01% | 6,953 |
| Joseph Lightburn | Theodore Billings | Constitution |
5,061 |
0.01% | 5,061 |
| Kirby Hensley | John Hopkins | Universal |
19 |
0.00% | 19 |
 |
Map Key
| Turnout
 |  |  |
|
| Maps | 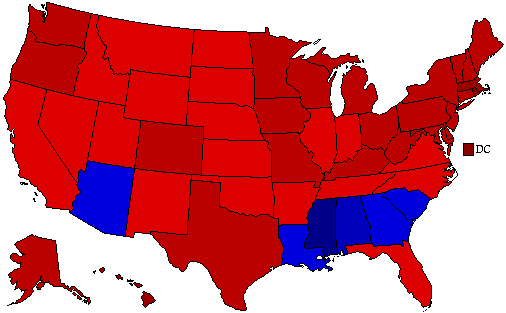 |  | | Dem. (m) | | Rep. (m) | | Swg (m) | | Tnd (m) |
| |
| Demographic Data
| 1970 Population: | 203,302,031 | Enum. | 1970 Population Density: | 22.2 | persons/km2 | | 1960 Population: | 179,323,175 | Enum. | 1960 Population Density: | 19.6 | persons/km2 | | Total Electoral Vote: | 70641539 | | | Land Area (2000): | 9,161,889 | km2 | Annual Pop Growth Rate: | 1.3 | % |
| Election Data and Statistics:
- Data (Table) (m)
- Data (Graphs)
- City and Town Data (m)
- Voter Registration & Turnout Data (m)
|
| | Election Tools
- Atlas Forum Image Code for Maps: County, Town, Tnd, Swg
Data Sources:
- Source for Popular Vote data:
- Source for Population data: U.S. Census Bureau.
| Results for and Individual :
|
|
| |
|


