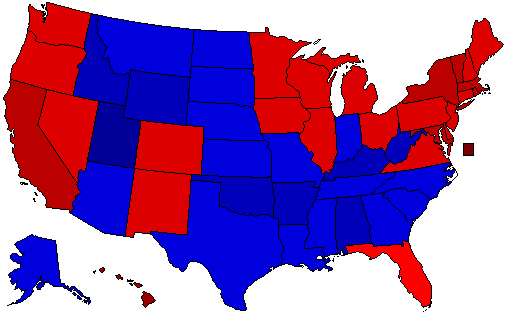
Unofficial Results
| |
Presidential
Candidate | Vice Presidential
Candidate | Political
Party | Popular Vote | Electoral Vote |
 | Barack H. Obama | Joseph R. Biden, Jr. | Democratic |
65,918,507 |
51.01% | 65,918,507 |
 | Willard Mitt Romney | Paul Ryan | Republican |
60,934,407 |
47.15% | 60,934,407 |
 | Gary Johnson | James P. Gray | Libertarian |
1,275,923 |
0.99% | 1,275,923 |
| Jill Stein | Cheri Honkala | Green |
469,015 |
0.36% | 469,015 |
| Write-ins | - | - |
284,920 |
0.22% | 284,920 |
| Virgil H. Goode, Jr. | James N. Clymer | Constitution |
122,417 |
0.09% | 122,417 |
| Roseanne Barr | Cindy Sheehan | Peace & Freedom |
67,477 |
0.05% | 67,477 |
| Ross C. 'Rocky' Anderson | Luis J. Rodriguez | Justice |
43,123 |
0.03% | 43,123 |
| Thomas Hoefling | Jonathan D. Ellis | American Ind. |
40,649 |
0.03% | 40,649 |
| Randall Terry | Marjorie Smith | Independent |
13,108 |
0.01% | 13,108 |
| Richard Duncan | Ricky Johnson | Independent |
12,558 |
0.01% | 12,558 |
| Peta Lindsay | Yari Osorio | Socialism and Liberation |
9,405 |
0.01% | 9,405 |
| None of these Candidates | - | - |
5,770 |
0.00% | 5,770 |
| Chuck Baldwin | Joseph Martin | Reform |
4,992 |
0.00% | 4,992 |
| Will Christensen | Ken Gibbs | Constitution |
4,456 |
0.00% | 4,456 |
| Stewart Alexander | Alex Mendoza | Socialist |
4,434 |
0.00% | 4,434 |
| James Harris | Maura DeLuca | Socialist Workers |
4,120 |
0.00% | 4,120 |
| Thomas R. Stevens | Alden Link | Objectivist |
4,091 |
0.00% | 4,091 |
| Jim Carlson | George McMahon | Grassroots |
3,149 |
0.00% | 3,149 |
| Jill Ann Reed | Thomas A. Cary | Independent |
2,923 |
0.00% | 2,923 |
| Merlin Miller | Harry V. Bertram | American Third Position |
2,716 |
0.00% | 2,716 |
| Sheila Tittle | Matthew A. Turner | We the People |
2,572 |
0.00% | 2,572 |
| Jerry White | Phyllis Scherrer | Socialist Equality |
1,281 |
0.00% | 1,281 |
| Dean Morstad | Josh Franke-Hyland | Const. Government |
1,094 |
0.00% | 1,094 |
| Jerry Litzel | Jim Litzel | Independent |
1,027 |
0.00% | 1,027 |
| Barbara Dale Washer | Cathy L. Toole | Reform |
1,016 |
0.00% | 1,016 |
| Jeff Boss | Bob Pasternak | NSA Did 911 |
1,008 |
0.00% | 1,008 |
| Andre Barnett | Kenneth Cross | Reform |
966 |
0.00% | 966 |
| Lowell 'Jack' Fellure | Toby Davis | Prohibition |
518 |
0.00% | 518 |
 |
Map Key
| > 40% |
 |
 |
| > 50% |
 |
 |
| > 60% |
 |
 |
| > 70% |
 |
 |
| > 90% |
 |
|
| Turnout
 |  |  |
|
|
| Demographic Data
| 2012 Population: | 313,877,662 | Est. | 2012 Population Density: | 34.3 | persons/km2 | | 2010 Population: | 308,745,538 | Enum. | 2010 Population Density: | 33.7 | persons/km2 | | Total Electoral Vote: | 129237642 | | Electoral Vote Density: | 2 | persons/EV | | Land Area (2000): | 9,161,889 | km2 | Annual Pop Growth Rate: | 0.8 | % |
| Election Data and Statistics:
| Election Tools
- Atlas Forum Image Code for Maps: County, Town, Pop, Tnd, Swg
Data Sources:
- Source for Popular Vote data:
- Source for Population data: U.S. Census Bureau.
| Results for and Individual :
| | Primary Documentation:
|
| The 2012 Campaign:
|
|
| |


