| |
Presidential
Candidate | Vice Presidential
Candidate | Political
Party | Popular Vote | Electoral Vote |
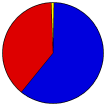
 | Willard Mitt Romney | Paul Ryan | AL Republican |
1,255,925 |
60.55% | 9 |
 | Barack H. Obama | Joseph R. Biden, Jr. | AL Democratic |
795,696 |
38.36% | 0 |
 | Gary Johnson | James P. Gray | Independent |
12,328 |
0.59% | 0 |
| Other (+) | - | - |
10,389 |
0.50% | 0 |
 |
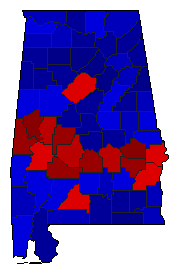
Map Key
| Turnout
 |  |  |
|
|
| Demographic Data
| 2012 Population: | 4,816,632 | Est. | 2012 Population Density: | 36.6 | persons/km2 | | 2010 Population: | 4,779,736 | Enum. | 2010 Population Density: | 36.4 | persons/km2 | | Total Electoral Vote: | 9 | | Electoral Vote Density: | 535,181 | persons/EV | | Land Area (2000): | 131,426 | km2 | Annual Pop Growth Rate: | 0.4 | % |
| Election Data and Statistics:
| Election Tools
- Atlas Forum Image Code for Maps: County, Pop, Tnd, Swg
Data Sources:
- Source for Popular Vote data: Alabama Office of the Secretary of State. State of Alabama Canvass of Results General Election November 6, 2012 - For President and Vice-President of the United States, Alabama Office of the Secretary of State (http://www.sos.state.al.us/downloads/election/2012/general/2012GeneralResults-AllStateAndFederalOfficesAndAmendments-WithoutWrite-inAppendix.pdf
) (accessed 05 Dec 2012)
- Source for Population data: U.S. Census Bureau.
| Results for and Individual County:
| | Primary Documentation:
|
| The 2012 Campaign:
|
|
| |


