Home
2024
Election Results
Election Info
Weblog
Forum
Wiki
Search
Email
Login
Site Info
Store
1992 Gubernatorial General Election Results - Delaware
Note: The Google advertisement links below may advocate political positions that this site does not endorse.
Gubernatorial
Candidate
Political
Party
Popular Vote
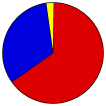
Thomas R. Carper
Democratic
179,365
64.74%
B. Gary Scott
Republican
90,725
32.75%
Floyd E. McDowell, Sr.
A Delaware
3,779
1.36%
Richard A. Cohen
Libertarian
3,165
1.14%
Map Key
> 40%
> 50%
> 60%
> 70%
Turnout
Maps
Pop. (m)
Dem. (m)
Rep. (m)
Demographic Data
2000 Population:
783,600
Enum.
2000 Population Density:
154.9
persons/km
2
1992 Population:
694,925
Est.
1992 Population Density:
137.3
persons/km
2
1990 Population:
666,168
Enum.
1990 Population Density:
131.7
persons/km
2
Land Area (2000):
5,060
km
2
Annual Pop Growth Rate:
1.6
%
Election Data and Statistics:
County Data (Table)
(m)
County Data (Graphs)
Purchase Detailed Data
Compare State Data by Year (Table)
Compare State Data by Year (Graphs)
View All 1992 Delaware Data
Compare State Maps by Year
View All 1992 Delaware Maps
Election Tools
Atlas Forum
Image Code for Maps:
County
,
Pop
Data Sources:
Source for Popular Vote data: State of Delaware Department of Elections, "Governor,"
State of Delaware 1992 General Election Returns
(Dover, 1992)
Source for Population data: U.S. Census Bureau.
Results for and Individual County:
(m)
Choose Year
2020
2016
2012
2008
2004
2000
1996
1988
1984
1980
1976
1972
1968
1964
1960
1956
1952
1948
1944
1940
1822
1819
1816
1813
1810
1807
1804
1801
1798
Choose Office
President
Lt. Governor
Insurance Commissioner
Choose State
Indiana
Missouri
Montana
New Hampshire
North Carolina
North Dakota
Rhode Island
Utah
Vermont
Washington
West Virginia
1996 >
Delaware Election Results Home
-
National Results for 1992
-
Use Frame Navigation
Login
Terms of Use
-
DCMA Policy
-
Privacy Policy and Cookies
©
Dave Leip's Atlas of U.S. Elections, LLC 2019 All Rights Reserved


