Home
2024
Election Results
Election Info
Weblog
Forum
Wiki
Search
Email
Login
Site Info
Store
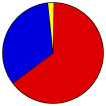
2012 Representative General Election Results
Note: The Google advertisement links below may advocate political positions that this site does not endorse.
Representative
Candidate
Political
Party
Popular Vote
John C. Carney, Jr.
Democratic
249,933
64.41%
Thomas H. Kovach
Republican
129,757
33.44%
Bernard August
Green
4,273
1.10%
Scott Gesty
Libertarian
4,096
1.06%
Map Key
> 40%
> 50%
> 60%
> 70%
Turnout
Maps
Demographic Data
2012 Population:
915,518
Est.
2012 Population Density:
180.9
persons/km
2
2010 Population:
897,934
Enum.
2010 Population Density:
177.5
persons/km
2
Land Area (2000):
5,060
km
2
Annual Pop Growth Rate:
1.0
%
Election Data and Statistics:
County Data (Table)
(m)
County Data (Graphs)
Congressional District Data
(m)
Purchase Detailed Data
Compare State Data by Year (Table)
Compare State Data by Year (Graphs)
View All 2012 Delaware Data
Compare State Maps by Year
View All 2012 Delaware Maps
Election Tools
Atlas Forum
Image Code for Maps:
County
,
CD
,
Pop
Data Sources:
Source for Popular Vote data:
Source for Population data: U.S. Census Bureau.
Results for and Individual County:
Kent County
New Castle County
Sussex County
The 2012 Campaign:
Pre-Election Polls
Choose Year
2022
2020
2018
2016
2014
Choose Office
President
Senator
Governor
Lt. Governor
Insurance Commissioner
Choose State
Alaska
Montana
North Dakota
South Dakota
Vermont
Wyoming
2014 >
Delaware Election Results Home
-
National Results for 2012
-
Use Frame Navigation
Login
Terms of Use
-
DCMA Policy
-
Privacy Policy and Cookies
©
Dave Leip's Atlas of U.S. Elections, LLC 2019 All Rights Reserved


