| |
Presidential
Candidate | Vice Presidential
Candidate | Political
Party | Popular Vote | Electoral Vote |
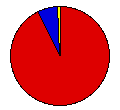
 | Barack H. Obama | Joseph R. Biden, Jr. | Democratic |
245,800 |
92.46% | 3 |
 | John S. McCain, III | Sarah Palin | Republican |
17,367 |
6.53% | 0 |
 | Write-ins | - | - |
1,138 |
0.43% | 0 |
| Ralph Nader | Matt Gonzalez | Independent |
958 |
0.36% | 0 |
| Cynthia A. McKinney | Rosa A. Clemente | DC Statehood Green |
590 |
0.22% | 0 |
 |
Map Key
| Turnout
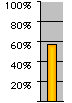 |  |  |
|
|
| Demographic Data
| 2010 Population: | 601,723 | Enum. | 2010 Population Density: | 3,784.4 | persons/km2 | | 2008 Population: | 580,236 | Est. | 2008 Population Density: | 3,649.3 | persons/km2 | | 2000 Population: | 572,059 | Enum. | 2000 Population Density: | 3,597.9 | persons/km2 | | Total Electoral Vote: | 3 | | Electoral Vote Density: | 193,412 | persons/EV | | Land Area (2000): | 159 | km2 | Annual Pop Growth Rate: | 0.5 | % |
| Election Data and Statistics:
| Election Tools
- Atlas Forum Image Code for Maps: County, Pop, Prc, Tnd, Swg
Data Sources:
- Source for Popular Vote data: District of Columbia Board of Elections and Ethics. Presidential General Election November 4, 2008 Summary Report District of Columbia Certified Election Results, District of Columbia Board of Elections and Ethics (
) (accessed 26 Nov 2008)
- Source for Population data: U.S. Census Bureau.
| Results for and Individual County:
| Primary Documentation:
- 2008 Certificate of Ascertainment (m)
- 2008 Certificate of Vote (m)
|
| The 2008 Campaign:
|
|
| |


