Note: The Google advertisement links below may advocate political positions that this site does not endorse.
  Presidential
Candidate
Vice Presidential
Candidate
Political
Party
Popular VoteElectoral Vote
Barack H. ObamaJoseph R. Biden, Jr.Democratic 306,658 70.55%4
Willard Mitt RomneyPaul RyanRepublican 121,015 27.84%0
Gary JohnsonJames P. GrayLibertarian 3,840 0.88%0
Jill SteinCheri HonkalaGreen 3,184 0.73%0
Seal Map Key
 > 40%
 > 50%
 > 60%
 > 70%
Turnout
Voter Turnout Graph
Vote Pie ChartState Seal
Maps
  2012 Hawaii County Map of General Election Results for President  
County Button
2000 Button
Pop Button
Cong Dist Button
Per Vote Democratic Button
Per Vote Republican Button
Swing Map Button
Trend Map Button
 
Demographic Data

2012 Population:1,395,199Est.2012 Population Density:84.0persons/km2
2010 Population:1,360,301Enum.2010 Population Density:81.9persons/km2
Total Electoral Vote:4Electoral Vote Density:348,800persons/EV
Land Area (2000):16,600km2Annual Pop Growth Rate:1.3%

Election Data and Statistics:
Election Tools
Data Sources:
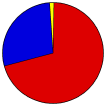
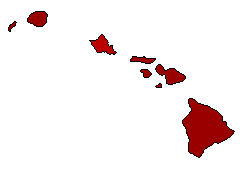
  • Source for Popular Vote data: State of Hawaii Office of Elections. State of Hawaii Statement of Vote Hawaii General 2012 November 06, 2012 - President and Vice President pp. 20-21, State of Hawaii Office of Elections (http://hawaii.gov/elections/results/2012/general/elections/results/2012/general/files/SOV.pdf ) (accessed 24 Nov 2012)
  • Source for Population data: U.S. Census Bureau.
Results for and Individual County:
Primary Documentation:
    The 2012 Campaign:


    Hawaii County Honolulu County Kauai County Maui County