| |
Presidential
Candidate | Vice Presidential
Candidate | Political
Party | Popular Vote | Electoral Vote |
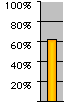
 | Richard Nixon | Spiro Agnew | Republican |
2,788,179 |
59.03% | 26 |
 | George McGovern | R. Sargent Shriver | Democrat |
1,913,472 |
40.51% | 0 |
 | Louis Fisher | G. Gunderson | Socialist Labor |
12,344 |
0.26% | 0 |
| Other (+) | - | - |
9,241 |
0.20% | 0 |
 |
Map Key
| Turnout
 |  |  |
|
| Maps | 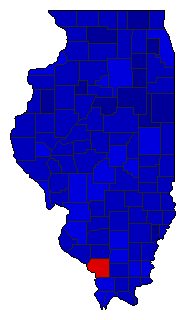 |  | | Pop. (m) | | Rep. (m) | | Dem. (m) | | Swg (m) | | Tnd (m) |
| |
| Demographic Data
| 1980 Population: | 11,427,409 | Enum. | 1980 Population Density: | 79.4 | persons/km2 | | 1972 Population: | 11,258,111 | Est. | 1972 Population Density: | 78.2 | persons/km2 | | 1970 Population: | 11,110,285 | Enum. | 1970 Population Density: | 77.2 | persons/km2 | | Total Electoral Vote: | 26 | | Electoral Vote Density: | 433,004 | persons/EV | | Land Area (2000): | 143,961 | km2 | Annual Pop Growth Rate: | 0.3 | % |
| Election Data and Statistics:
| Election Tools
- Atlas Forum Image Code for Maps: County, Pop, Tnd, Swg
Data Sources:
- Source for Popular Vote data: Illinois Office of the Secretary of State, State of Illinois Official Vote Cast at the General Election, November 7, 1972 (Springfield, 1972)
- Source for Population data: U.S. Census Bureau.
| Results for and Individual County:
|
|
| |


