Home
2024
Election Results
Election Info
Weblog
Forum
Wiki
Search
Email
Login
Site Info
Store
1982 Comptroller General General Election Results - Illinois
Note: The Google advertisement links below may advocate political positions that this site does not endorse.
Data for this Contest was Contributed by on 2018-09-18
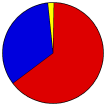
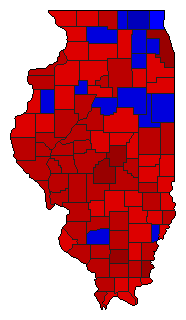
Comptroller General
Candidate
Political
Party
Popular Vote
Roland W. Burris
Democratic
2,327,779
64.43%
Cal Skinner, Jr.
Republican
1,210,467
33.50%
Leland W. Bormann
Taxpayers
37,835
1.05%
Stephen M. Johnson
Libertarian
36,856
1.02%
Write-ins
-
12
0.00%
Map Key
> 40%
> 50%
> 60%
> 70%
Turnout
Maps
Pop. (m)
Demographic Data
1990 Population:
11,430,602
Enum.
1990 Population Density:
79.4
persons/km
2
1982 Population:
0
Est.
1982 Population Density:
0.0
persons/km
2
1980 Population:
11,427,409
Enum.
1980 Population Density:
79.4
persons/km
2
Land Area (2000):
143,961
km
2
Annual Pop Growth Rate:
0.0
%
Election Data and Statistics:
County Data (Table)
(m)
County Data (Graphs)
Purchase Detailed Data
Compare State Data by Year (Table)
Compare State Data by Year (Graphs)
View All 1982 Illinois Data
Compare State Maps by Year
View All 1982 Illinois Maps
Election Tools
Atlas Forum
Image Code for Maps:
County
,
Pop
Data Sources:
Source for Popular Vote data: Illinois State Board of Elections.
Official Vote Cast at the General Election November 2, 1982
, Illinois State Board of Elections (https://archive.org/details/officialvoteofst1982illi) (accessed 18 Sep 2018)
Source for Population data: U.S. Census Bureau.
Results for and Individual County:
(m)
Choose Year
2022
2018
2016
2014
2010
2006
2002
1998
1994
1990
1986
1978
1976
1972
Choose Office
Governor
Secretary of State
State Treasurer
Attorney General
Choose State
California
Connecticut
Maryland
2022 >
Illinois Election Results Home
-
National Results for 1982
-
Use Frame Navigation
Login
Terms of Use
-
DCMA Policy
-
Privacy Policy and Cookies
©
Dave Leip's Atlas of U.S. Elections, LLC 2019 All Rights Reserved


