Home
2024
Election Results
Election Info
Weblog
Forum
Wiki
Search
Email
Login
Site Info
Store
1998 Senatorial General Election Results - Alaska
Note: The Google advertisement links below may advocate political positions that this site does not endorse.
Senatorial
Candidate
Political
Party
Popular Vote
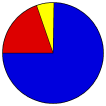
Frank Murkowski
Republican
165,227
74.49%
Joseph Sonneman
Democratic
43,743
19.72%
Jeffrey Gottlieb
Green
7,126
3.21%
Scott Kohlhaas
Libertarian
5,046
2.27%
Write-ins
-
665
0.30%
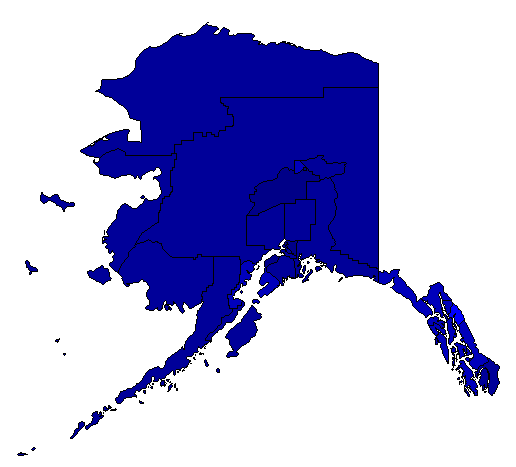
Map Key
> 40%
> 50%
> 60%
> 70%
> 80%
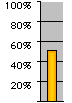
Turnout
Maps
Rep. (m)
Dem. (m)
Demographic Data
2000 Population:
626,932
Enum.
2000 Population Density:
0.4
persons/km
2
1998 Population:
619,932
Est.
1998 Population Density:
0.4
persons/km
2
1990 Population:
550,043
Enum.
1990 Population Density:
0.4
persons/km
2
Land Area (2000):
1,481,347
km
2
Annual Pop Growth Rate:
1.3
%
Election Data and Statistics:
Election District Data (Table)
(m)
Election District Data (Graphs)
Purchase Detailed Data
Compare State Data by Year (Table)
Compare State Data by Year (Graphs)
View All 1998 Alaska Data
Compare State Maps by Year
View All 1998 Alaska Maps
Election Tools
Atlas Forum
Image Code for Maps:
County
Data Sources:
Source for Popular Vote data: State of Alaska Division of Elections.
Election Summary Report State of Alaska 1998 General Election Official Results
, State of Alaska Division of Elections ( ) (accessed 09 May 2006)
Source for Population data: U.S. Census Bureau.
Results for and Individual Election District:
(m)
< 1996
Choose Year
2022
2020
2016
2014
2010
2008
2004
2002
1996
1992
1990
1986
1984
1980
1978
1974
1972
1970
1968
1966
1962
1960
Choose Office
Governor
Choose State
Alabama Class 3
Arizona Class 3
Arkansas Class 3
California Class 3
Colorado Class 3
Connecticut Class 3
Florida Class 3
Georgia Class 3
Hawaii Class 3
Idaho Class 3
Illinois Class 3
Indiana Class 3
Iowa Class 3
Kansas Class 3
Kentucky Class 3
Louisiana Class 3
Maryland Class 3
Missouri Class 3
Nevada Class 3
New Hampshire Class 3
New York Class 3
North Carolina Class 3
North Dakota Class 3
Ohio Class 3
Oklahoma Class 3
Oregon Class 3
Pennsylvania Class 3
South Carolina Class 3
South Dakota Class 3
Utah Class 3
Vermont Class 3
Washington Class 3
Wisconsin Class 3
2002 >
Alaska Election Results Home
-
National Results for 1998
-
Use Frame Navigation
Login
Terms of Use
-
DCMA Policy
-
Privacy Policy and Cookies
©
Dave Leip's Atlas of U.S. Elections, LLC 2019 All Rights Reserved


