Home
2024
Election Results
Election Info
Weblog
Forum
Wiki
Search
Email
Login
Site Info
Store
1996 Senatorial Republican Primary Election Results - Kansas
Note: The Google advertisement links below may advocate political positions that this site does not endorse.
Data for this Contest was Contributed by on 2010-05-28
Senatorial
Candidate
Political
Party
Popular Vote
Pat Roberts
Republican
245,411
78.21%
Tom Little
Republican
25,052
7.98%
Thomas L. Oyler
Republican
23,266
7.41%
Richard L. Cooley
Republican
20,060
6.39%
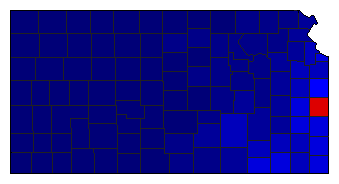
Map Key
> 40%
> 50%
> 60%
> 70%
> 80%
> 90%
Turnout
Maps
Pop. (m)
Demographic Data
2000 Population:
2,688,418
Enum.
2000 Population Density:
12.7
persons/km
2
1996 Population:
2,614,554
Est.
1996 Population Density:
12.3
persons/km
2
1990 Population:
2,477,588
Enum.
1990 Population Density:
11.7
persons/km
2
Land Area (2000):
211,900
km
2
Annual Pop Growth Rate:
0.8
%
Election Data and Statistics:
County Data (Table)
(m)
County Data (Graphs)
Purchase Detailed Data
Compare State Maps by Year
View All 1996 Kansas Maps
Election Tools
Atlas Forum
Image Code for Maps:
County
,
Pop
Data Sources:
Source for Popular Vote data: Kansas Secretary of State.
Election Statistics
, Kansas Secretary of State (http://www.kssos.org/elections/elmpast/96primry.exe) (accessed 28 May 2010)
Source for Population data: U.S. Census Bureau.
Results for and Individual County:
(m)
Choose Year
2010
1978
Choose Office
Choose State
Alabama
Colorado
Georgia
Illinois
Iowa
Maine
Michigan
Nebraska
Oregon
South Carolina
Texas
Wyoming
Kansas Election Results Home
-
National Results for 1996
-
Use Frame Navigation
Login
Terms of Use
-
DCMA Policy
-
Privacy Policy and Cookies
©
Dave Leip's Atlas of U.S. Elections, LLC 2019 All Rights Reserved


